

THE AI PARTY STUMBLES, OIL BOILS, AND CENTRAL BANKS KEEP EVERYONE GUESSING
Chart Book for 2nd November 2026
October finished with a familiar lesson: shares can rise on expectations for months, then stumble when somebody asks about the profits. We saw the S&P 500 fall 0.6% for the week to 7,580, while the Nasdaq lost 2%. Friday was particularly ugly as investors questioned the eventual return on colossal AI spending. NVIDIA dropped 4.2% that day. Tesla, however, gained 7.4% across the week. Not every technology darling received the same treatment.
And we shouldn't overlook that distinction. Disappointing forecasts are one thing; a market suddenly less willing to pay heroic multiples is another. Even fundamentally healthy businesses can suffer when valuations become difficult to justify.
The Fed held rates at 3.75–4.00%, although two policymakers voted for a quarter-point rise. Third-quarter US GDP expanded 3.4% annualised, while September core PCE inflation remained at 3.1%. Strong growth and stubborn prices aren't making the Fed's job any easier.
The ECB also kept its deposit rate at 2.50%, warning about the energy shock. EUR/USD briefly tested 1.11 before finishing Friday near 1.116. London's FTSE 100 closed at 10,729.78, helped by AstraZeneca and defence stocks, despite pressure on banks and miners.
Oil was more dramatic. December Brent settled at $117.64 after another tanker attack in the Strait of Hormuz, although that contract expired Friday; January futures were nearer $113. Gold offered little shelter, sinking to around $3,880 as rate worries and liquidation pressures overwhelmed its traditional appeal.
Bitcoin fell towards $76,000 after Binance confirmed approximately $6.3 billion in stolen assets. The exchange says it will cover customers' losses, but confidence in crypto custody has taken another knock.
Looking ahead, we've got Tuesday's US midterms, Apple's and AMD's results, and Friday's American jobs report. We'll be watching S&P 7,500, Bitcoin $75,000 and the oil futures curve.
Our preference? Real earnings, sensible diversification and enough cash to avoid becoming forced sellers. We still see opportunities, but we suspect the market has rather less patience for promises.
Introduction to our Chart Book
In today’s volatile market environment, our technical analysis provides a clear, data-driven framework to support informed investment decisions. By evaluating price action, momentum indicators, and trend behavior across equities, commodities, and indices, we identify key support and resistance levels, reversal signals, and emerging opportunities. Using tools such as Elliott Wave theory, MACD, and Stochastics, we deliver actionable insights to improve trade timing, manage risk, and capture short- to medium-term market moves. This disciplined approach enhances precision and confidence for investors navigating shifting economic conditions.
Read on for our Technical Analysis: This week, we have reviewed the daily charts to provide a broader perspective on market trends.
EURUSD - Daily chart
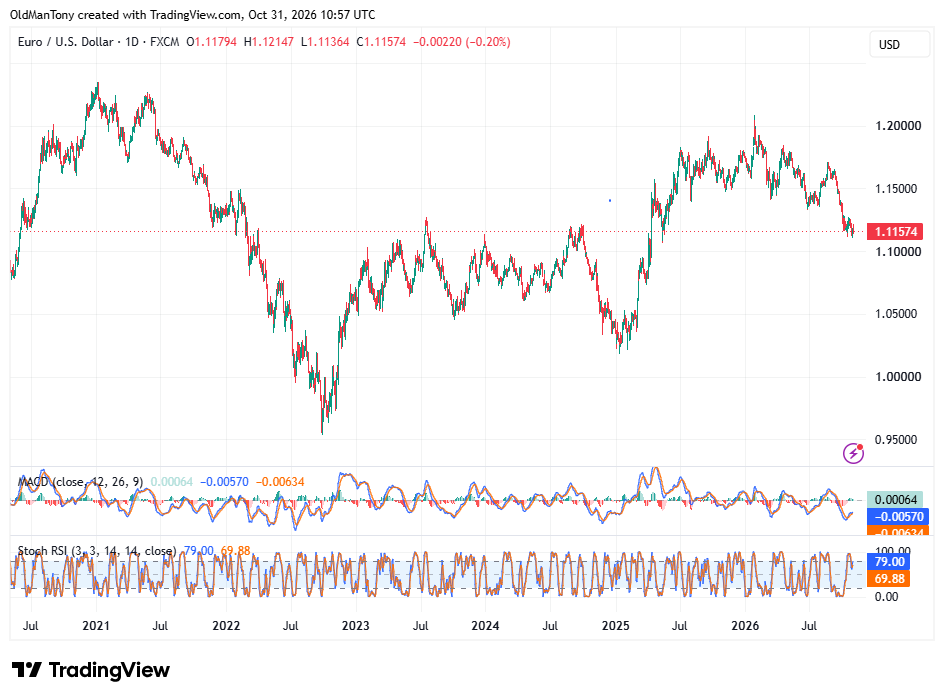
EUR/USD has continued to weaken after failing repeatedly around 1.1800–1.2000. The decline from the 2026 highs has produced a sequence of lower highs and lower lows, with price now testing the important 1.1100–1.1150 area. This zone has acted as a significant pivot several times since 2022.
Immediate support sits around 1.1100. A daily close beneath it would expose 1.1000, followed by 1.0800–1.0850. The latter region represents a major long-term pivot and would probably attract more substantial buying. Initial resistance lies around 1.1200–1.1250, followed by 1.1400 and 1.1500. We’d need to see a recovery above 1.1500 before describing the broader decline as complete.
MACD provides a cautiously encouraging signal. Both lines remain below zero, but the MACD line has crossed above its signal line and the histogram has turned positive. This suggests bearish momentum is easing and raises the possibility of a corrective rebound. Nevertheless, a bullish crossover beneath zero is an early warning—not proof of a lasting reversal.
Stochastic RSI is elevated, with readings around 79 and 70. That indicates the recent attempt to stabilise is already becoming stretched. If the oscillator turns lower while EUR/USD remains beneath 1.1250, another test of 1.1100 would become likely.
From an Elliott Wave perspective, the decline from the 2026 high near 1.2000 appears to be developing as a five-wave bearish sequence. The recent low may have completed Wave 3, with the present consolidation representing Wave 4. If that interpretation is correct, a final Wave 5 decline towards 1.1000–1.1100 remains possible.
We’d therefore treat rallies towards 1.1250–1.1400 cautiously unless the price breaks the pattern of lower highs. The euro is attempting to stabilise, but it hasn’t yet earned the right to be called bullish.
S&P 500
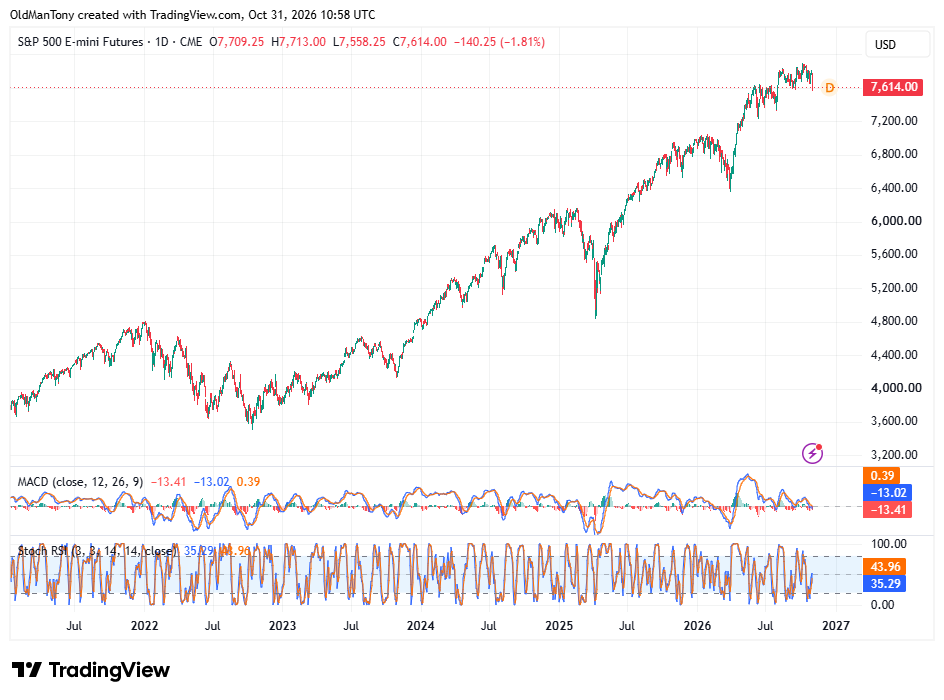
The S&P 500 remains within a powerful multiyear bull market, but the daily chart is showing signs of exhaustion near record highs. Price has repeatedly failed to extend beyond approximately 7,850–7,900 and has now fallen sharply to around 7,614. The latest session traded as low as 7,558 before recovering slightly, showing some buying interest but also considerable intraday damage.
Immediate support sits between 7,550 and 7,600. A daily close below that zone would expose 7,400–7,450, followed by the major breakout area around 7,200–7,250. Resistance has fallen to 7,700–7,720, with stronger barriers at 7,800 and 7,900. The index must recover 7,800 before the latest decline can be dismissed as another ordinary shakeout.
MACD is close to neutral. Both lines are below zero, although the MACD line has moved marginally above its signal line and the histogram is slightly positive. This suggests selling momentum may be stabilising, but it doesn’t yet provide a convincing bullish signal.
Stochastic RSI is neutral-to-weak, with readings around 35 and 44. The faster line remains below the signal line, leaving the index vulnerable to another downside test. We’d want to see a bullish crossover from lower levels before increasing exposure.
The Elliott Wave count suggests the advance from the 2022 low may have completed a large five-wave sequence near 7,900. If so, the current weakness could represent the beginning of an A-B-C correction rather than a simple pause. The first downside objective would lie around 7,400, with 7,200 possible if selling broadens.
We’re not declaring the bull market dead—the long-term structure remains impressive. But mature trends deserve disciplined risk management. Below 7,550, we’d reduce risk; above 7,800, the bulls regain control.
Bitcoin (BTC/USD)
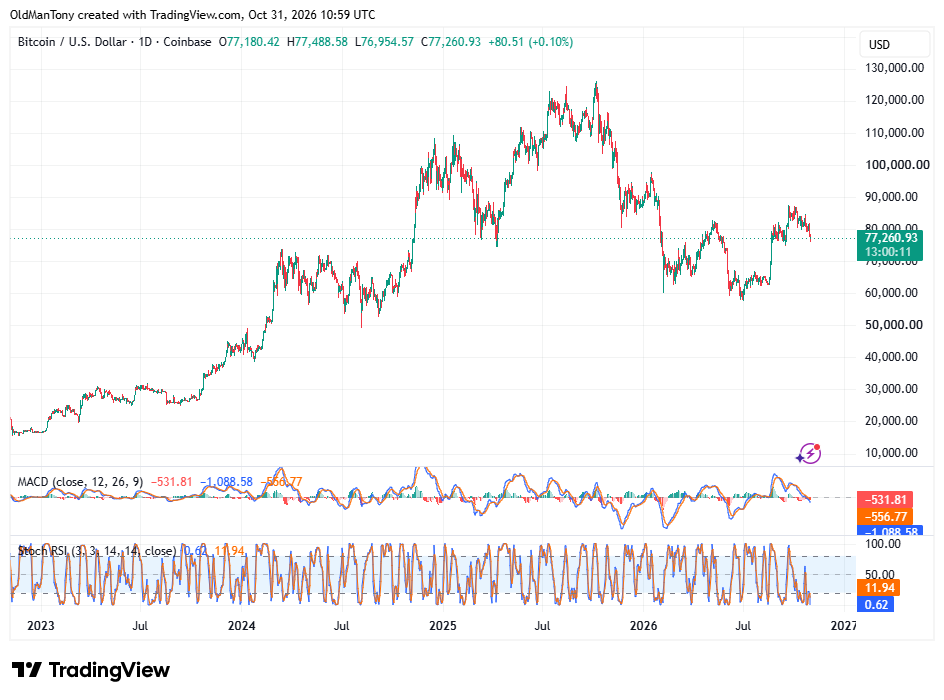
Bitcoin remains in a broad corrective phase following its peak above $120,000. The decline initially reached approximately $80,000, followed by a rebound towards $95,000, but sellers returned quickly. The price is now around $77,260 and approaching an important support area.
We see immediate support between $75,000 and $77,000. A decisive daily close below $75,000 would expose $70,000, followed by the stronger $62,000–$65,000 zone. On the upside, Bitcoin must recover $80,000 before short-term pressure begins to ease. Stronger resistance sits around $85,000 and $90,000–$95,000. Only a sustained break above $95,000 would materially repair the broader structure.
MACD is bearish. Both lines are below zero, the MACD line remains beneath its signal line, and the negative histogram confirms weakening momentum. The present reading isn’t as extreme as during earlier sell-offs, but it offers little evidence that buyers have regained control.
Stochastic RSI is deeply oversold, with readings close to zero and 12. This creates the conditions for a relief rally, particularly from $75,000. However, we’d wait for the faster line to cross above the signal line before treating the oscillator as a genuine reversal signal.
Our preferred Elliott Wave interpretation is that the advance from the 2022 low completed a major five-wave structure above $120,000. The first fall towards $80,000 formed Wave A, while the rebound towards $95,000 represented Wave B. The current decline may be Wave C, with $70,000–$75,000 offering a plausible target area.
A bounce from current levels would not automatically end the correction. We’d need to see Bitcoin recover $85,000 and then $95,000. Until that happens, the oversold condition may produce rallies, but the daily trend remains bearish, and capital preservation should take priority over heroics.
Oil (WTI Crude)
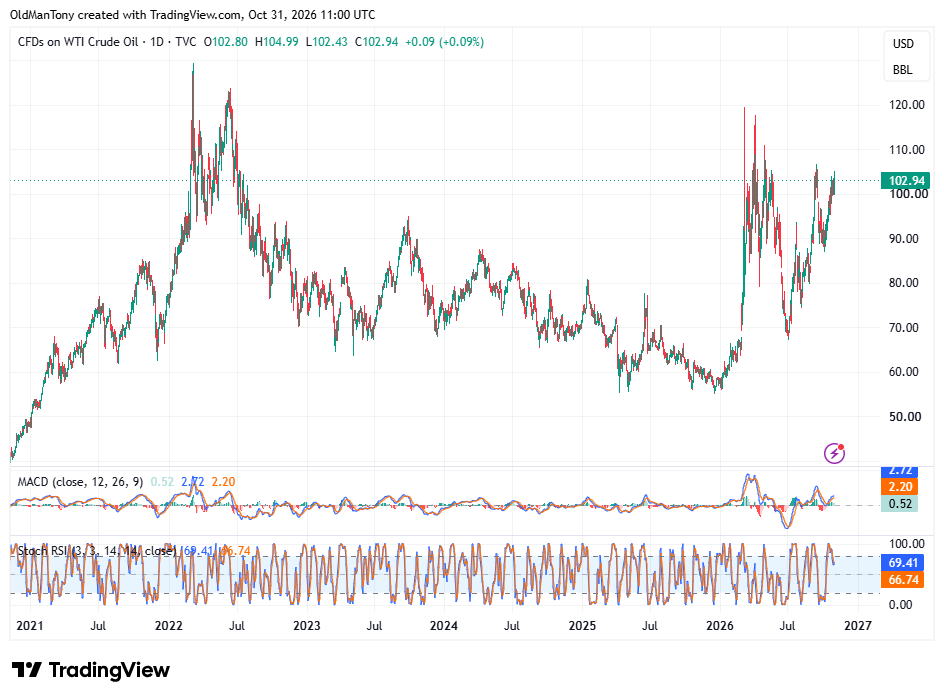
WTI remains technically constructive after recovering from the 2025 low around $56. The market has endured extraordinary volatility, including moves above $115 and below $70, but the latest structure is defined by higher lows and renewed pressure against the $103–$105 resistance area.
A daily close above $105 would be significant. It would clear the recent swing highs and open the route towards $110, followed by $115–$120. That said, the $103–$106 region has repeatedly attracted selling, so we wouldn’t assume a breakout before it happens. Initial support lies around $98–$100, with stronger levels at $92–$94 and $85–$88. A break below $92 would materially weaken the current bullish pattern.
MACD remains positive. Both lines are above zero, the MACD line is above its signal line, and the histogram is modestly bullish. Momentum supports the advance, although it isn’t yet strong enough to confirm a decisive breakout. We’d watch for expansion in the histogram if the price closes above $105.
Stochastic RSI remains elevated, with readings around 69 and 67. It has eased from overbought territory without collapsing, which is generally constructive. However, another bearish crossover near resistance would increase the likelihood of a pullback towards $98–$100.
The Elliott Wave picture suggests the 2025 low near $56 began a new five-wave advance. The first surge may have completed Wave 1 above $115, followed by a deep Wave 2 correction towards $68. The recovery now appears to be part of Wave 3, although the overlapping price action prevents complete confidence.
We remain bullish while WTI holds above $92, but a close above $105 is the confirmation level. Above it, momentum could accelerate rapidly. Below $98, patience would be sensible because another period of oil-market indigestion may be required.
Gold (XAU/USD)
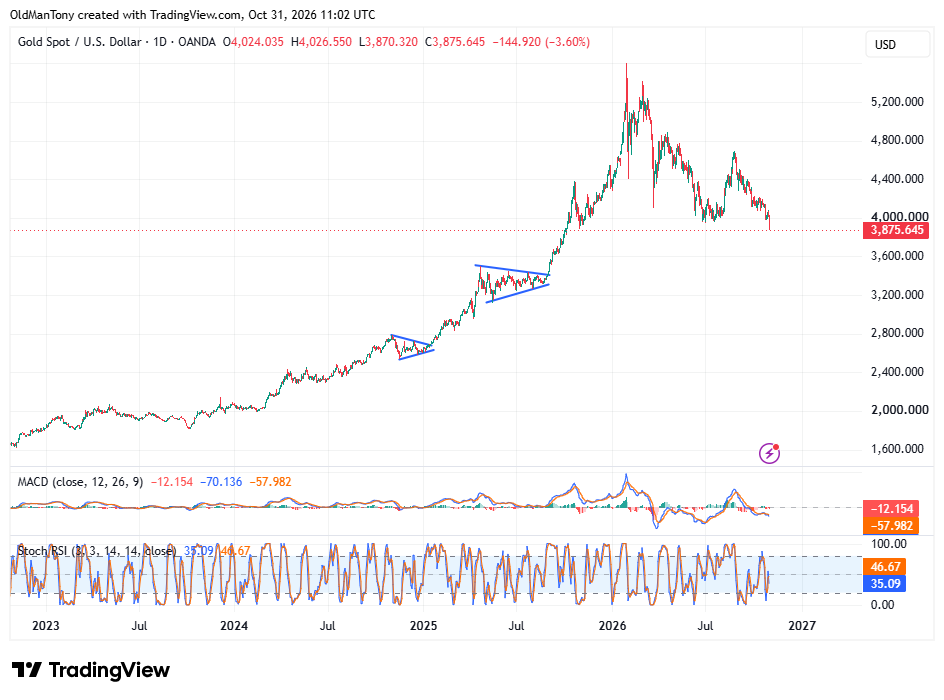
Gold’s spectacular advance has given way to an equally serious correction. After accelerating from approximately $3,400 to above $5,200, the market reversed sharply and has now fallen towards $3,875. The parabolic section of the rally has been unwound, and the daily chart continues to show lower highs and lower lows.
The immediate support zone lies between $3,800 and $3,875. Below that, we’d watch $3,600, which marks the breakout from the large triangular consolidation shown on the chart. A daily close beneath $3,600 would expose $3,400–$3,450 and imply that the correction has considerably further to run. Resistance begins around $4,000–$4,050, followed by $4,200 and $4,450.
MACD remains firmly bearish. Both lines are deeply below zero, the MACD line is beneath its signal line, and the negative histogram has expanded again. This tells us downside momentum remains active. Until the histogram contracts or a bullish crossover forms, rebounds should be treated cautiously.
Stochastic RSI has recovered towards neutral, with readings around 35 and 47. The faster line is still beneath the signal line, and the recovery in the oscillator hasn’t generated any meaningful improvement in price. That is a warning that sellers remain in charge.
From an Elliott Wave perspective, the advance from the 2022 low appears to have completed a large five-wave structure at the spike above $5,200. The fall towards $4,000 may have been Wave A, followed by a Wave B rebound towards $4,600. The current decline would then be Wave C, with $3,600–$3,800 providing a plausible completion zone.
We’d avoid attempting to catch the bottom while momentum remains negative. Gold is approaching important support, but the chart needs either a bullish divergence, a reversal candle or a recovery above $4,050 before we can argue that the correction has run its course.
UK100 Index
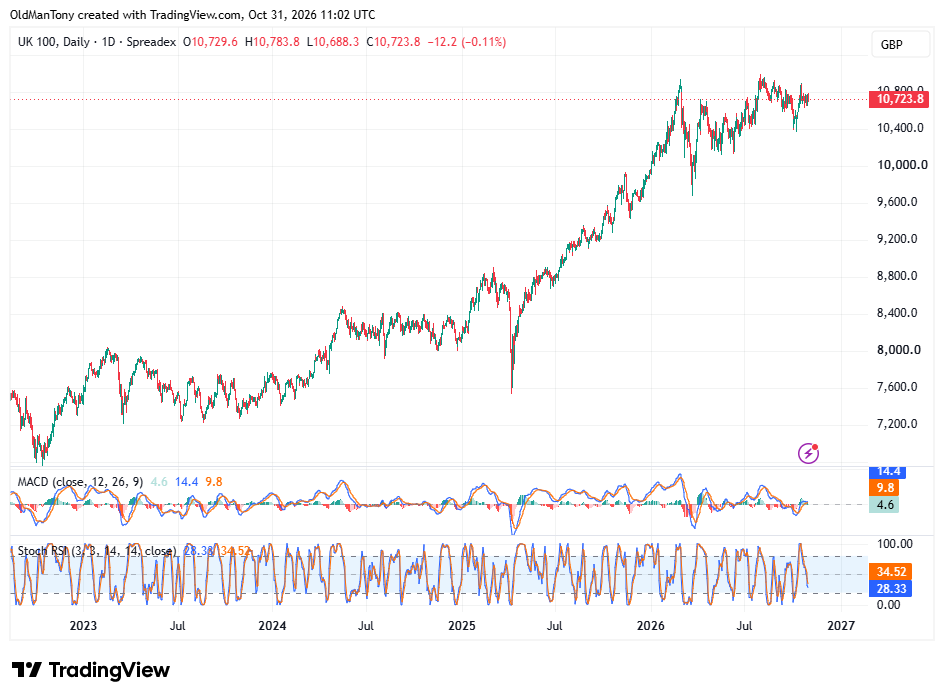
The FTSE 100 remains in a powerful long-term uptrend, although the past several months have been dominated by consolidation near the highs. After rising from below 7,000 in late 2022 to almost 11,000, the index has earned the right to pause. The question is whether this is healthy accumulation or a broad topping process.
Price is currently around 10,724. Immediate resistance sits between 10,800 and 10,900, with the record area around 10,950–11,000 representing the decisive ceiling. A daily close above 11,000 would confirm the longer-term advance has resumed and could target 11,200. Support lies around 10,600, followed by 10,400. A break beneath 10,400 would complete a broad distribution pattern and expose 10,200–10,000.
MACD has turned positive. Both lines are above zero, the MACD line is above its signal line, and the histogram is modestly bullish. Momentum isn’t particularly forceful, but it suggests the latest consolidation hasn’t yet developed into a significant bearish reversal.
Stochastic RSI is approaching oversold territory, with readings near 28 and 35. The faster line remains below its signal line, so we haven’t yet received a bullish crossover. Nevertheless, the index is no longer stretched on the upside, leaving room for renewed buying if support holds.
The Elliott Wave structure suggests the advance from the 2022 low may be in its fifth and final major wave. Within that structure, the early-2026 surge towards 10,900 could have completed Wave 3, while the subsequent sideways movement represents an extended Wave 4. If that count is correct, one more push above 11,000 remains possible.
We’d maintain a cautiously constructive view while the FTSE holds above 10,400. However, this is a mature trend, and a failure at 11,000 followed by a break of support would deserve considerably more respect than an ordinary dip.
Tesla
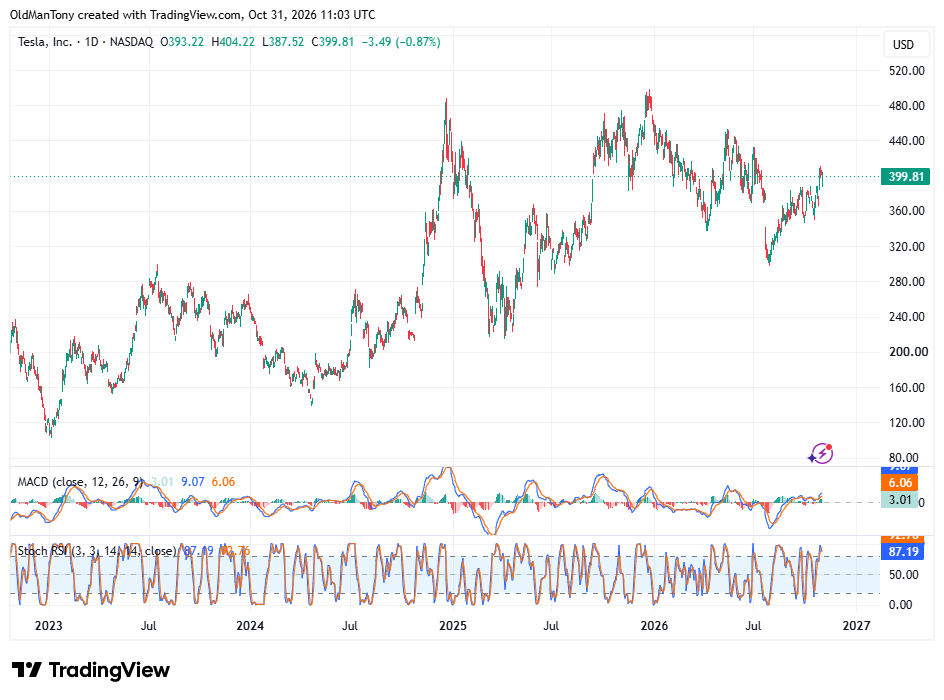
Tesla’s daily chart has improved considerably since the August low near $300. The recovery has produced a sequence of higher lows and has now carried the price back towards $400. However, this remains a major technical barrier rather than a confirmed breakout.
We see immediate resistance between $400 and $405. Tesla briefly traded above $404 before closing at approximately $399.80, showing that sellers are still active around the round number. A daily close above $405 would strengthen the bullish argument and expose $420, followed by $440–$450. Support begins around $385–$390, with more important levels at $365–$370 and $350. A close below $365 would disrupt the recent recovery structure.
MACD is encouraging. Both lines are above zero, the MACD line is above its signal line, and the positive histogram confirms improving momentum. The signal isn’t especially powerful, but it supports the higher-low pattern and suggests buyers retain an advantage while the price holds above $385.
Stochastic RSI is overbought, with readings around 87 and 93. The faster line has begun to soften beneath the signal line, warning that the latest rally may be stretched. That doesn’t automatically imply a reversal, but it makes chasing Tesla directly beneath $405 less attractive.
Our Elliott Wave interpretation treats the fall from the late-2025 high near $500 to the August low around $300 as a completed corrective sequence. The subsequent rally may represent a new five-wave advance, with the latest move towards $405 forming Wave 3. If so, a Wave 4 pullback towards $380–$390 could occur before another attempt at $420–$440.
Overall, we remain cautiously bullish above $365, but Tesla needs to conquer $405 before the daily chart offers a cleaner continuation signal.
NVIDIA
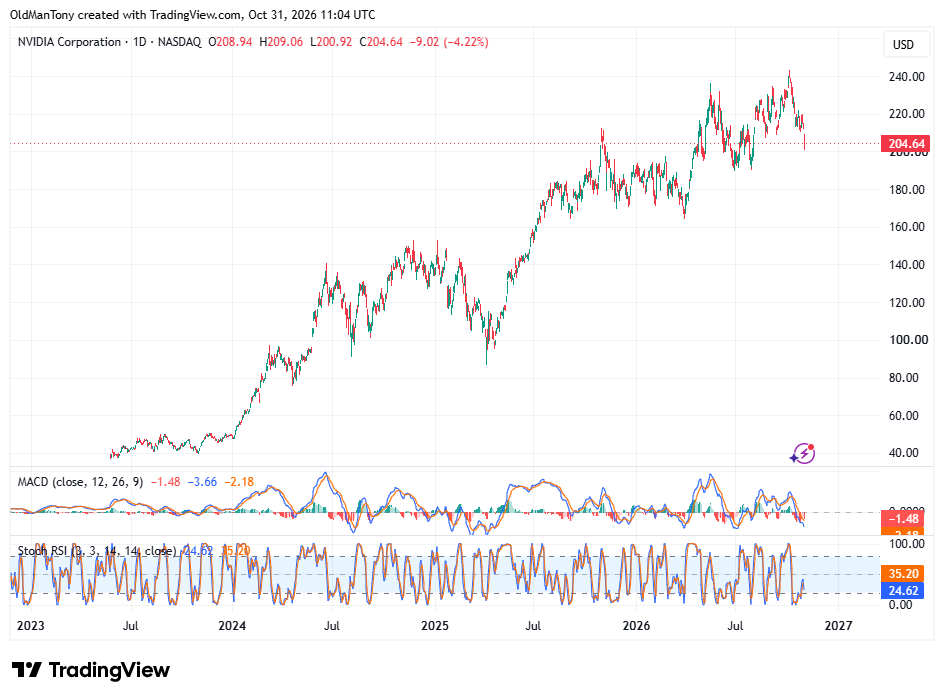
NVIDIA’s long-term advance remains intact, but the daily chart has shifted into a meaningful correction. After reaching approximately $240–$245, the price formed a lower high and has now fallen sharply towards $205. The latest daily candle closed near its low after trading down to roughly $201, showing that sellers retained control into the close.
The immediate support area is $200–$205. This is both psychologically important and close to the previous breakout region. If it fails on a daily closing basis, we’d expect a deeper retreat towards $190–$195, followed by the more substantial $178–$182 zone. Initial resistance sits around $212–$215, with stronger barriers at $220 and $230. NVIDIA must recover $220 before the short-term structure begins to look constructive again.
MACD is bearish. Both lines are below zero, the MACD line remains beneath its signal line, and the negative histogram is expanding. That confirms the latest fall is supported by deteriorating momentum rather than being a harmless intraday shakeout. We’d need to see the histogram contract before assuming the selling phase is nearing completion.
Stochastic RSI is recovering from deeply oversold territory, with readings around 25 and 35. However, the faster line remains below the signal line. This leaves room for a bounce, but there is no confirmed bullish reversal yet.
From an Elliott Wave perspective, the rise from the April 2025 low near $90 appears to contain a completed five-wave advance into $240–$245. The current decline may therefore be Wave A of a broader A-B-C correction. A rebound from $200 could form Wave B and revisit $215–$225, but a later Wave C towards $190 or $180 remains possible. We’d respect $200, but wouldn’t blindly buy it without evidence that momentum has turned.
Glossary
Stochastic RSI (StochRSI):
The Stochastic RSI is a momentum indicator that combines the Stochastic Oscillator and the Relative Strength Index (RSI) to measure the speed and direction of price movements. It is primarily used to identify overbought or oversold conditions, helping traders anticipate potential trend reversals. By focusing on the relative position of the RSI within its recent range, StochRSI offers more sensitivity to price changes, making it ideal for spotting short-term trading opportunities.
MACD (Moving Average Convergence Divergence):
The MACD is a trend-following and momentum indicator that highlights changes in an asset's strength, direction, and duration. By comparing short-term and long-term moving averages, the MACD helps traders identify potential buy or sell signals and confirm the overall trend. Its histogram visually represents momentum, making it useful for gauging the strength of market moves and spotting potential reversals or continuations.
Elliot Wave:
Elliott Wave Theory, developed by Ralph Nelson Elliott in the 1930s, is a technical analysis tool that predicts market price movements through repetitive patterns called waves, driven by investor psychology. It suggests prices move in a cycle of eight waves: a 5-wave impulsive structure in the direction of the main trend (Wave 1 starts the trend, Wave 2 pulls back, Wave 3 is the strongest, Wave 4 pulls back again, and Wave 5 completes the trend), followed by a 3-wave corrective structure (Wave A moves against the trend, Wave B bounces, and Wave C moves against the trend again). These patterns repeat across different time scales, reflecting market sentiment swings between optimism and pessimism. By identifying these waves, traders can anticipate price movements and make better decisions on when to buy or sell.
Disclaimer: This article is for educational purposes only and should not be considered financial advice. Market conditions can change rapidly, and trading involves significant risk.
Follow us, and keep yourself up to date with news and views about what's going on in the world's financial markets.
Latest News

A Blue Wave, a Red-Faced President and an AI Hangover

Election Fever, Dollar Strength and That AI IPO

Industrials – Is underperformance temporary?

