

Capital Markets Weekly Wrap: Chaos on Friday Changes Everything
The past week looked relatively stable until Friday, October 10th, when markets absolutely imploded in what traders are calling one of the most violent selloffs since April.
The Trigger: Trump's Tariff Bombshell
President Trump threatened a "massive" tariff hike on China over a rare earths dispute and cancelled his upcoming meeting with Chinese President Xi Jinping . The reaction was swift and brutal. Flaring trade tensions between the US and China sent shockwaves across markets Friday, hammering stocks, oil and crypto while spurring a dash for the perceived safety of Treasuries and gold.
Equity Carnage
The Dow fell 879 points, or 1.9%. The S&P 500 dropped 2.71% and the tech-heavy Nasdaq Composite slid 3.56% —marking the S&P 500's worst day since April 10. The Magnificent Seven tech stocks plunged 3.8%, led by losses in Tesla and Amazon. What's particularly painful is that this wipeout erased the entire week's gains in a single session.
Crypto Bloodbath
Bitcoin didn't escape the carnage. Bitcoin fell $3,000 immediately when Trump's post went live, with some analysts comparing the violent price action to the March 2020 Covid pandemic crash. Crypto market traders were hit by record liquidations exceeding $6 billion just days after Bitcoin touched an all-time high. The whipsaw from euphoria to panic was stunning.
Commodities Split
While stocks and crypto collapsed, safe-haven gold continued its relentless climb, benefiting from the flight to safety. Oil, however, joined the selloff as traders priced in the economic damage from escalating trade wars.
Looking Ahead
Next week will be critical. Watch for any walk-back or escalation of Trump's tariff threats—markets are hanging on every word. Can the S&P 500 hold above 6,500, or are we headed for deeper corrections? Bitcoin's ability to reclaim $120,000 will signal whether crypto bulls can maintain composure. And don't ignore the VIX—fear gauges spiked Friday, suggesting volatility is back with a vengeance. The trade war narrative has returned as the dominant market force, and that changes everything.
Introduction to our Chart Book
In this dynamic and uncertain market environment, our technical analysis aims to provide investors with a clear, data-driven framework to navigate volatility and make informed decisions. By examining price patterns, momentum indicators, and market trends across equities, commodities, and indices, this analysis identifies critical support and resistance levels, potential reversals, and emerging opportunities. Leveraging tools like Elliott Wave theory, MACD, and Stochastics, we offer actionable insights that help investors time their entries and exits more effectively, manage risk, and capitalize on short- and medium-term market movements. In a landscape shaped by trade tensions, inflation fears, and shifting economic outlooks, this technical approach equips investors with the precision and confidence needed to optimize their strategies and achieve better outcomes.
Our Technical Analysis
EURUSD
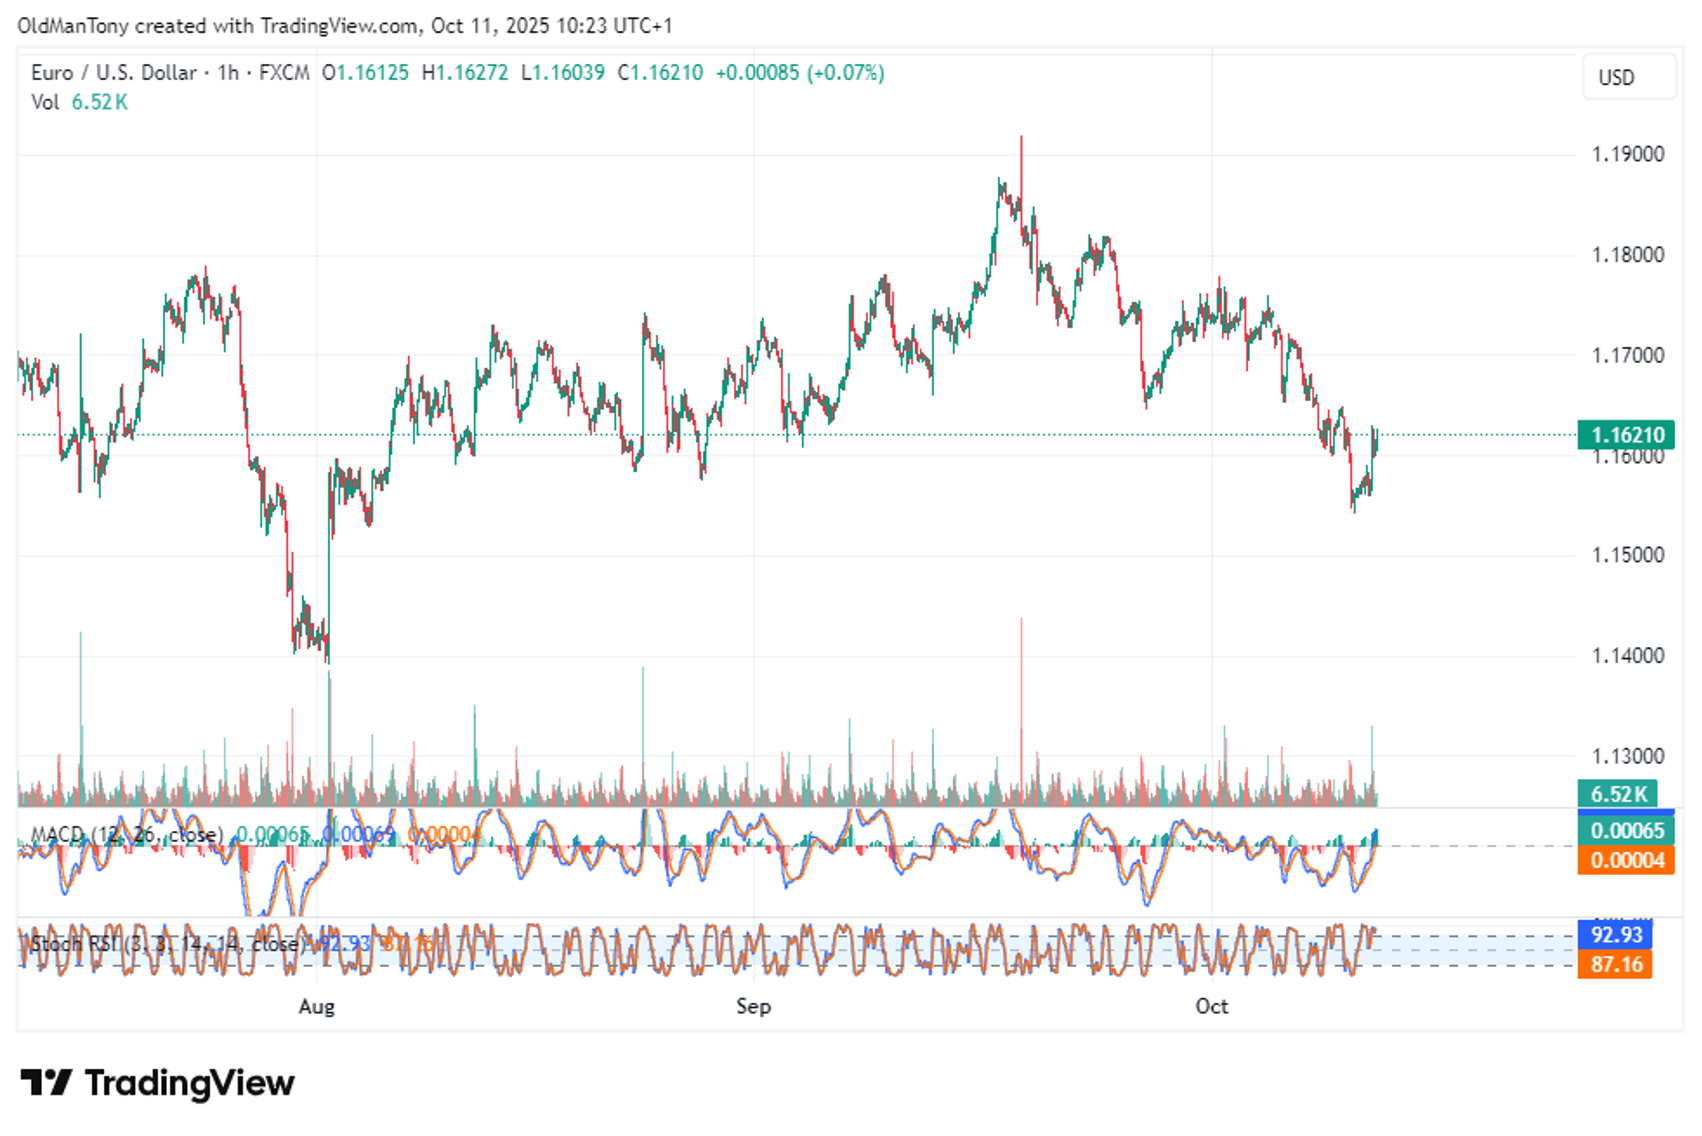
Chart Pattern & Trend: The pair has been in a clear downtrend since late September when it peaked around 1.1900. We can identify a descending channel pattern, with price recently testing the lower boundary near 1.1560 before bouncing back. The current consolidation around 1.1620 suggests we're seeing a potential relief rally, though the broader structure remains bearish.
MACD: The MACD histogram shows signs of bullish divergence at recent lows, with the signal lines converging near the zero line. This crossover suggests diminishing bearish momentum, though we'd like to see a more decisive move above zero to confirm any reversal.
Stochastics: The stochastic oscillator is currently around the 92 level, indicating overbought conditions on this timeframe. This warns us that the recent bounce may be running out of steam in the very short term, and we could see some pullback before any further upside.
Elliott Wave Perspective: From an Elliott Wave standpoint, the decline from 1.1900 appears to be a five-wave impulsive move lower, suggesting we've completed a primary wave down. The current bounce could be wave 2 corrective rally, which typically retraces 50-61.8% of wave 1. We'd watch the 1.1720-1.1750 zone as potential resistance.
Conclusion: Short-term oversold bounce in play, but overall trend remains down. Watch 1.1650-1.1680 resistance.
S&P 500
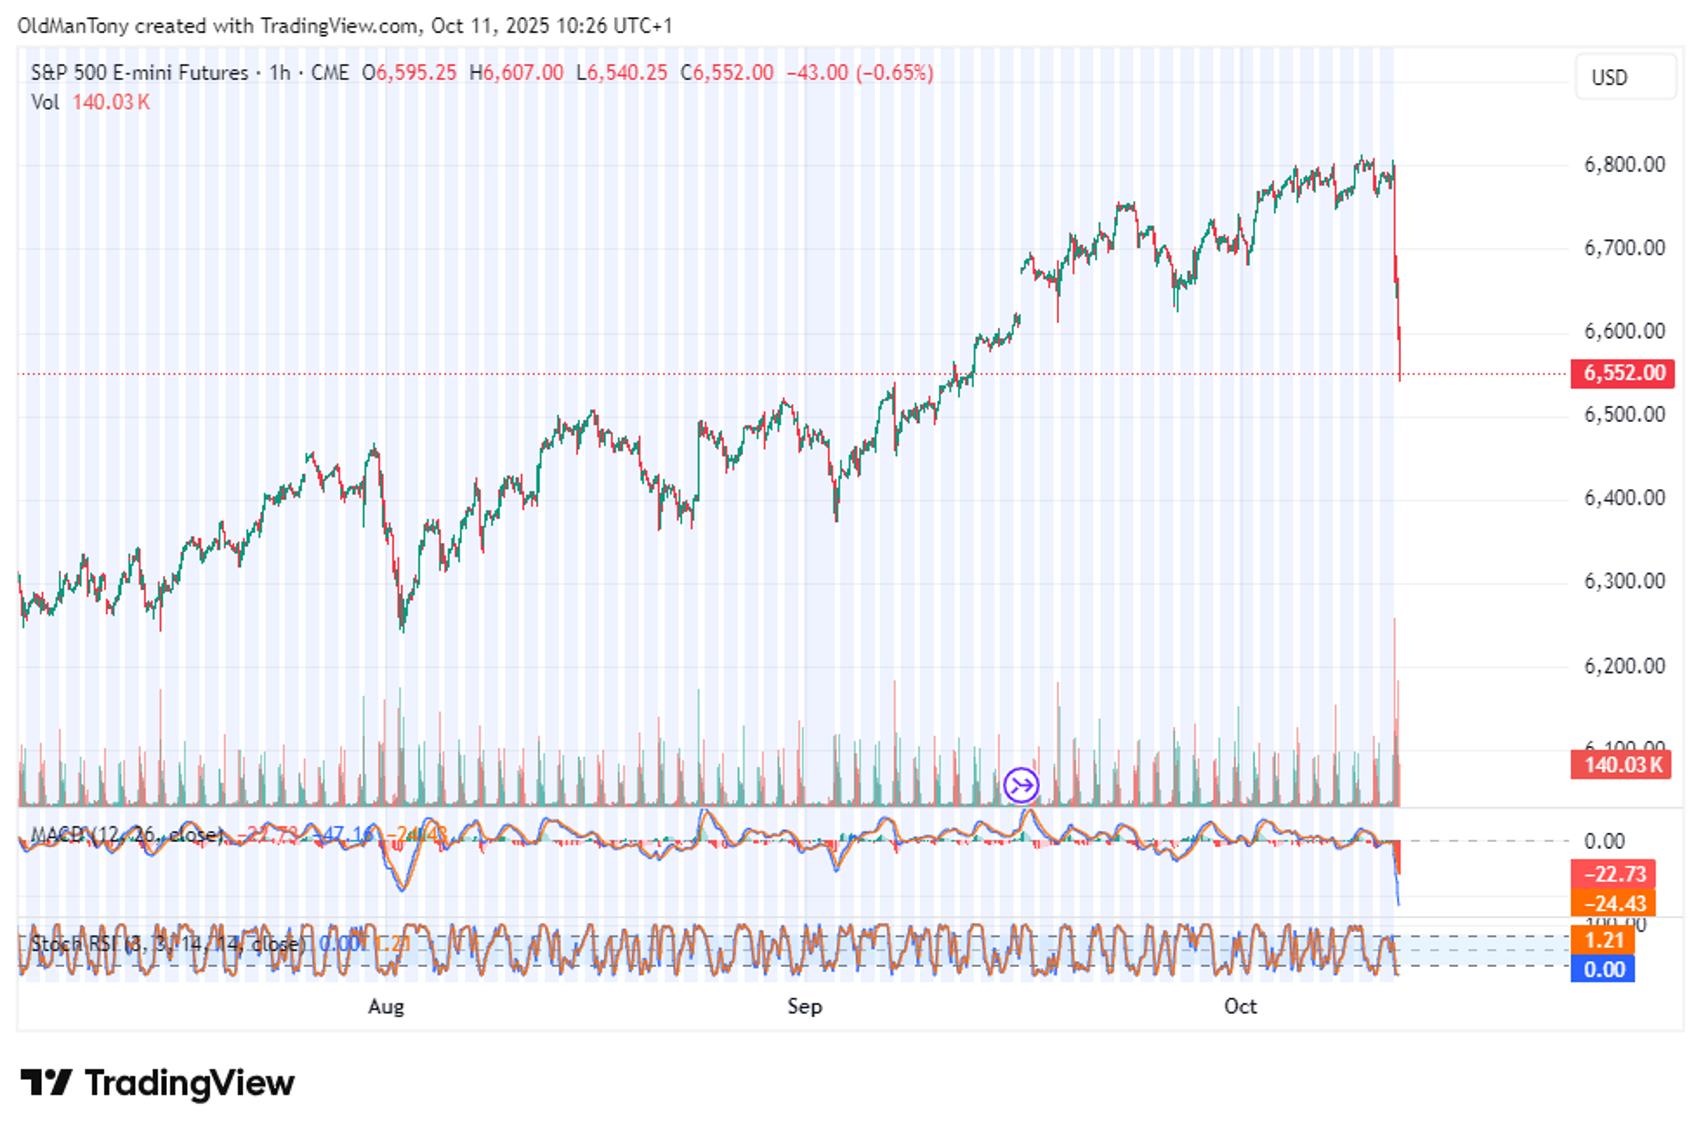
Chart Pattern & Trend: The most striking feature here is the dramatic breakdown from what appears to be a rising wedge or channel that had been in place since early August. Price reached a peak around 6,800 before this recent sharp decline. We're seeing a textbook breakdown with strong momentum, and the speed of this move suggests panic selling rather than orderly distribution.
MACD: The MACD has rolled over aggressively and is now at -22.71, showing the steepest decline we've seen in months. This represents significant bearish momentum, though the extreme reading also suggests we could be approaching short-term oversold territory. The signal line divergence is widening, which typically precedes either capitulation or a dead-cat bounce.
Stochastics: Stochastics have crashed to near-zero levels (1.21), indicating extreme oversold conditions. Historically, these readings can persist during strong trends, but they also increase the probability of a technical bounce soon.
Elliott Wave Perspective: The rally from August lows appears to have completed a five-wave structure, with the recent peak potentially marking the end of an extended wave 5. What we're witnessing now could be the beginning of a significant A-wave correction or even a larger degree trend change.
Conclusion: Sharp breakdown with extreme momentum. Near-term bounce likely due to oversold conditions, but the technical damage is severe. Watch 6,500 support.
Bitcoin (BTC/USD)
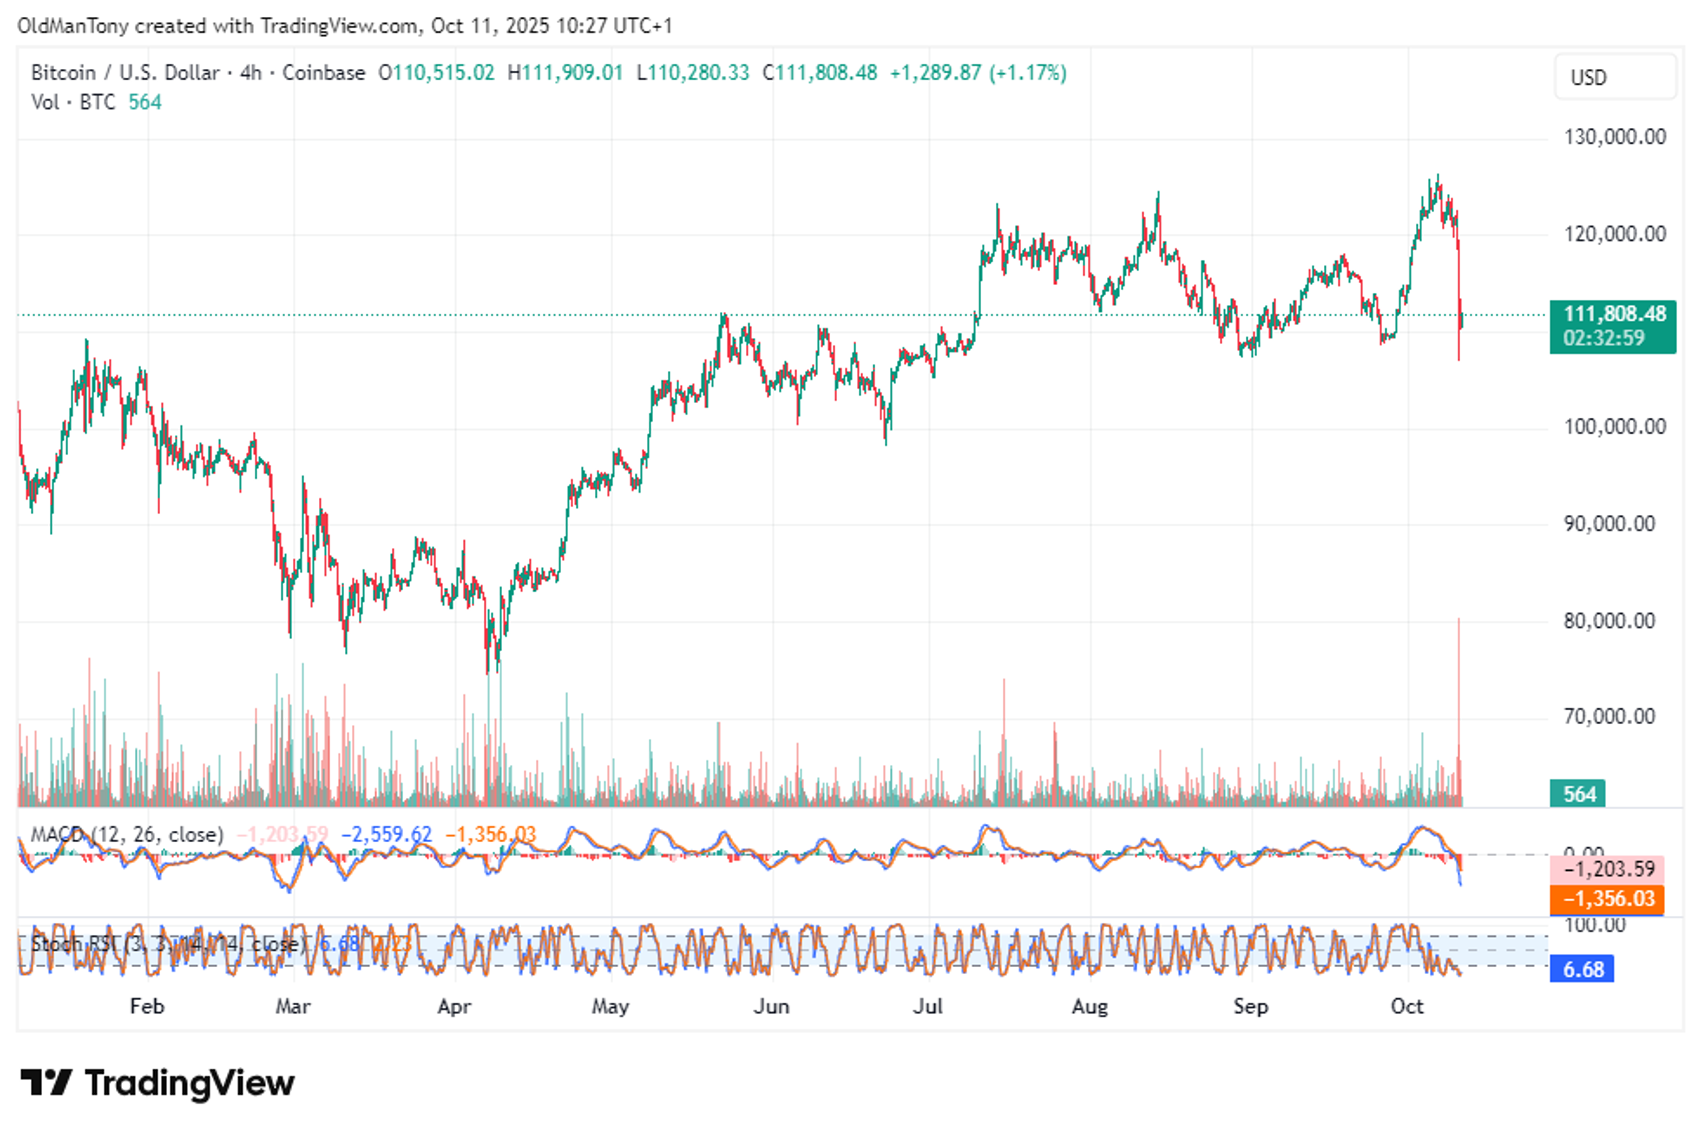
Chart Pattern & Trend: We can observe on this 4-hour chart that Bitcoin has been trading in a broad consolidation range between roughly $100,000 and $130,000 since June. We can identify a potential double-top formation around the $127,000-$130,000 level from July and October, which is a classic bearish reversal pattern. The recent rejection from the October highs and subsequent breakdown is concerning. Price has violated several support levels and appears to be accelerating lower, breaking below the key psychological $112,000 support zone.
MACD: The MACD is deeply negative at -1,356.03, showing one of the steepest declines we've observed in this timeframe all year. The histogram bars are expanding to the downside, confirming strong bearish momentum. This reading rivals the March sell-off intensity, suggesting serious distribution is underway.
Stochastics: Stochastics have plunged to extremely oversold levels at 6.68. While this indicates potential for a technical bounce, we've learned from past Bitcoin moves that oversold can stay oversold during strong trends. The indicator suggests caution for shorts here, but not necessarily a buy signal yet.
Elliott Wave Perspective: The rally structure from the April lows appears to have completed a corrective three-wave move (A-B-C), with the October peak potentially marking the end of wave C. We may now be in the early stages of a new impulsive decline.
Conclusion: Significant technical breakdown from double-top. Oversold bounce possible, but trend has shifted bearish. Watch $108,000-$110,000 support zone.
Oil (WTI Crude)
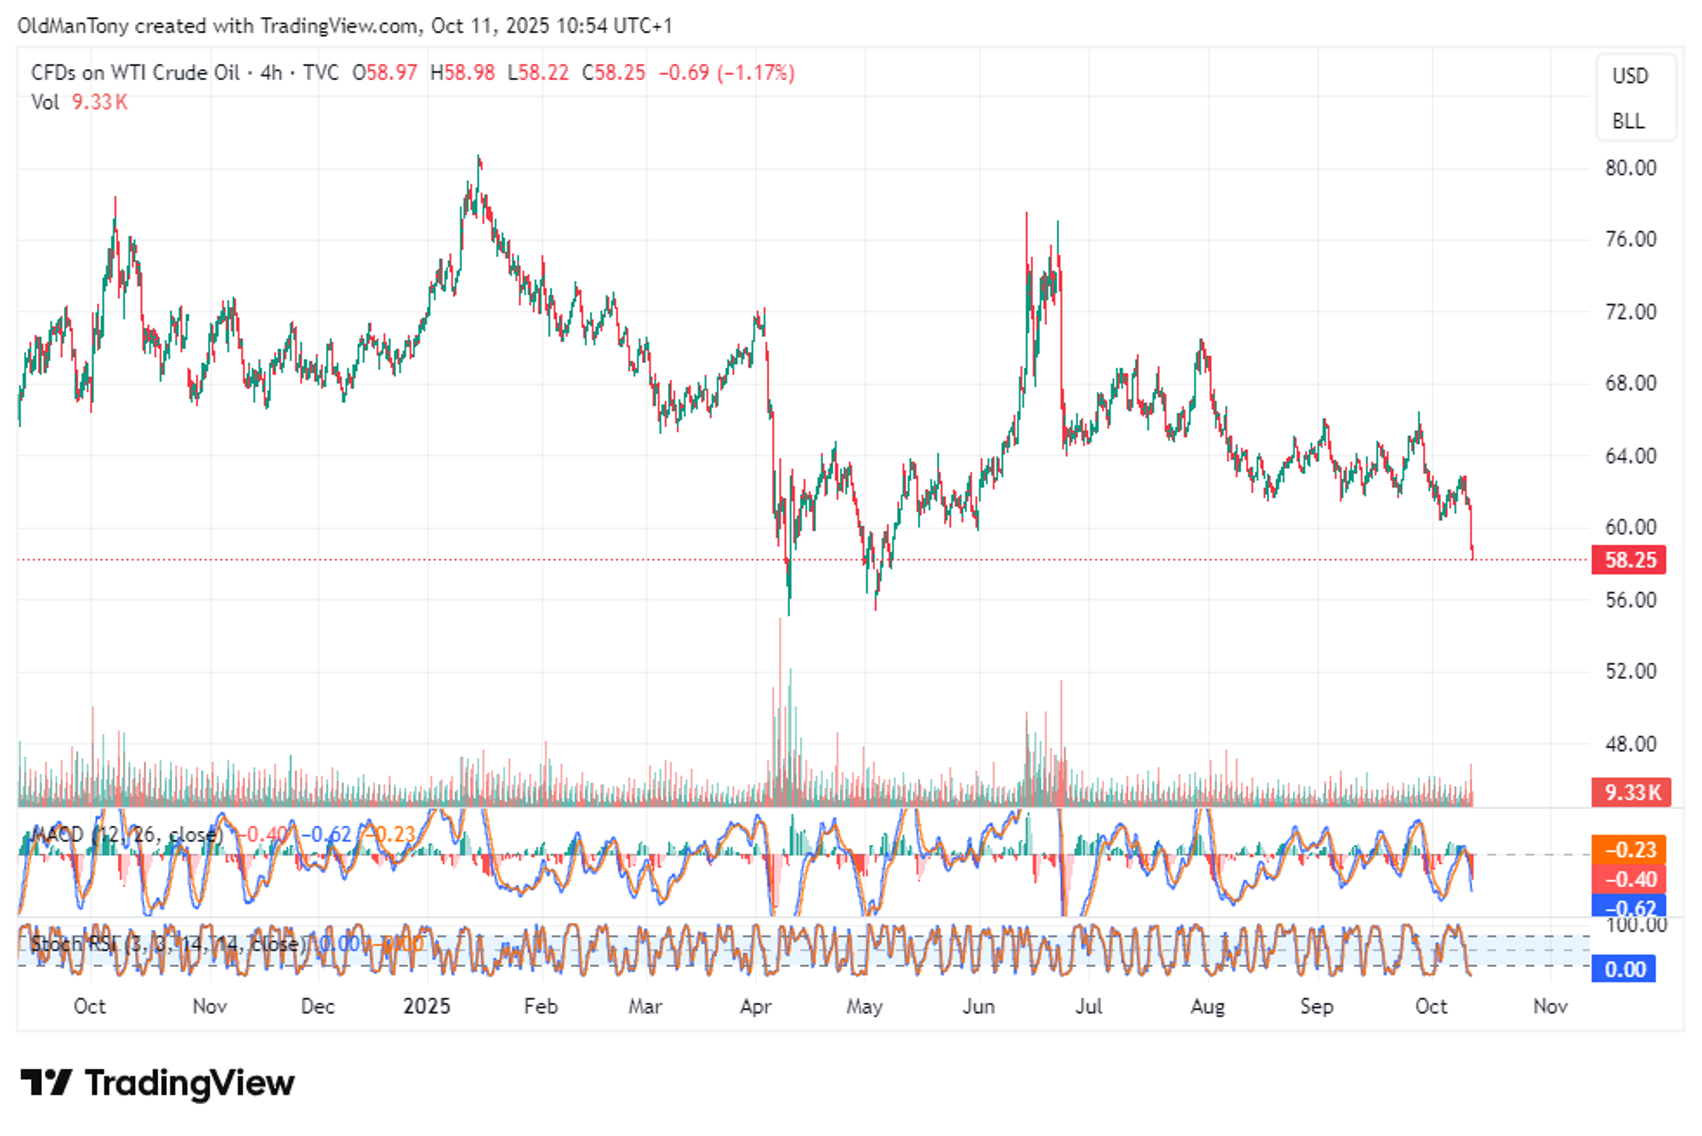
Chart Pattern & Trend: Looking at a 4-hour chart, we can see Oil has been in a persistent downtrend since the July peak around $77. We're observing a series of lower highs and lower lows, forming a well-defined descending channel. The recent price action shows a breakdown below the $60 psychological support level, which had provided some stability in recent weeks. This break is particularly significant as $60 has historically been an important technical and fundamental level for crude.
MACD: The MACD is printing at -0.23, with both the MACD line and signal line trending below zero. What's noteworthy is the persistent negative divergence throughout the downtrend—we're not seeing any meaningful bullish crossovers. The histogram remains in bearish territory, suggesting the path of least resistance continues to be lower. The momentum is weakening but hasn't reversed.
Stochastics: Stochastics are at rock-bottom levels (0.00), indicating extreme oversold conditions. We've seen similar readings during previous sell-offs this year, and they've typically led to short-term bounces. However, the fact that stochastics keep returning to these extremes tells us the underlying trend remains firmly bearish.
Elliott Wave Perspective: From an Elliott Wave standpoint, the decline from July appears impulsive, suggesting we're in a larger degree downtrend. The current move could be an extended wave 3 or approaching a wave 5 terminus.
Conclusion: Persistent downtrend with fresh support breakdown. Extreme oversold suggests bounce potential, but trend remains bearish. Watch $56-$57 next support.
Gold (XAU/USD)
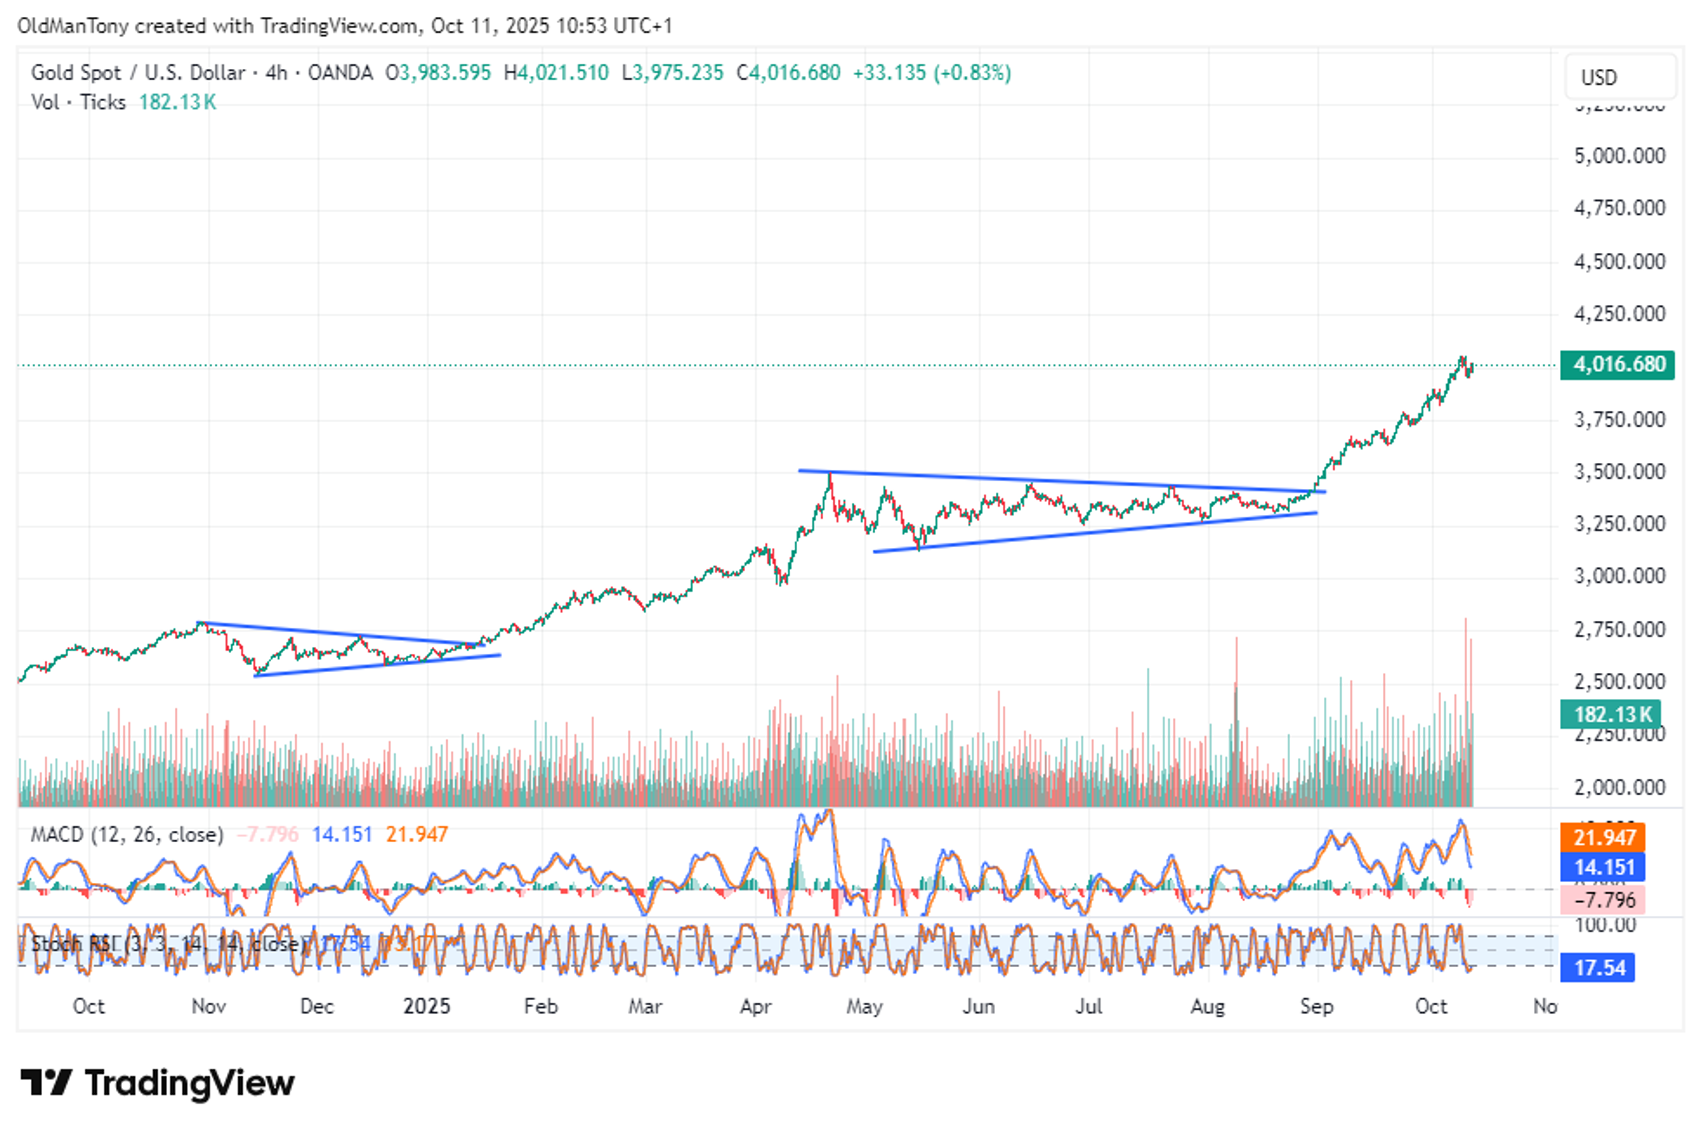
Chart Pattern & Trend: Gold is displaying an impressive bullish breakout from a multi-month ascending triangle pattern that formed between April and September. The consolidation phase saw price coiling between roughly $3,200-$3,500 before exploding higher in late September. We've now broken through significant resistance and are trading at fresh highs. The blue trendlines we've drawn clearly illustrate the compression pattern that preceded this breakout. This is textbook bullish continuation, and the momentum suggests we could be entering a parabolic phase.
MACD: The MACD sits at 21.947, well into positive territory with the MACD line firmly above the signal line. What's encouraging for bulls is that the histogram has been consistently positive since the breakout, showing sustained buying pressure. The indicator hasn't shown signs of bearish divergence yet, though at these elevated levels, we'd watch for any momentum loss carefully.
Stochastics: Stochastics are reading 17.34, which is actually relatively low despite the strong uptrend. This is somewhat unusual and could indicate that Gold is taking healthy pauses during its ascent, preventing it from becoming overextended. There's room for further upside before reaching overbought extremes.
Elliott Wave Perspective: The breakout appears to have initiated a strong wave 3 extension within a larger impulse sequence. These third waves typically show the strongest momentum and can exceed expectations.
Conclusion: Powerful breakout from triangle pattern. Momentum strong with no divergence signals. Bulls in control, watch $4,100 next.
UK100 Index
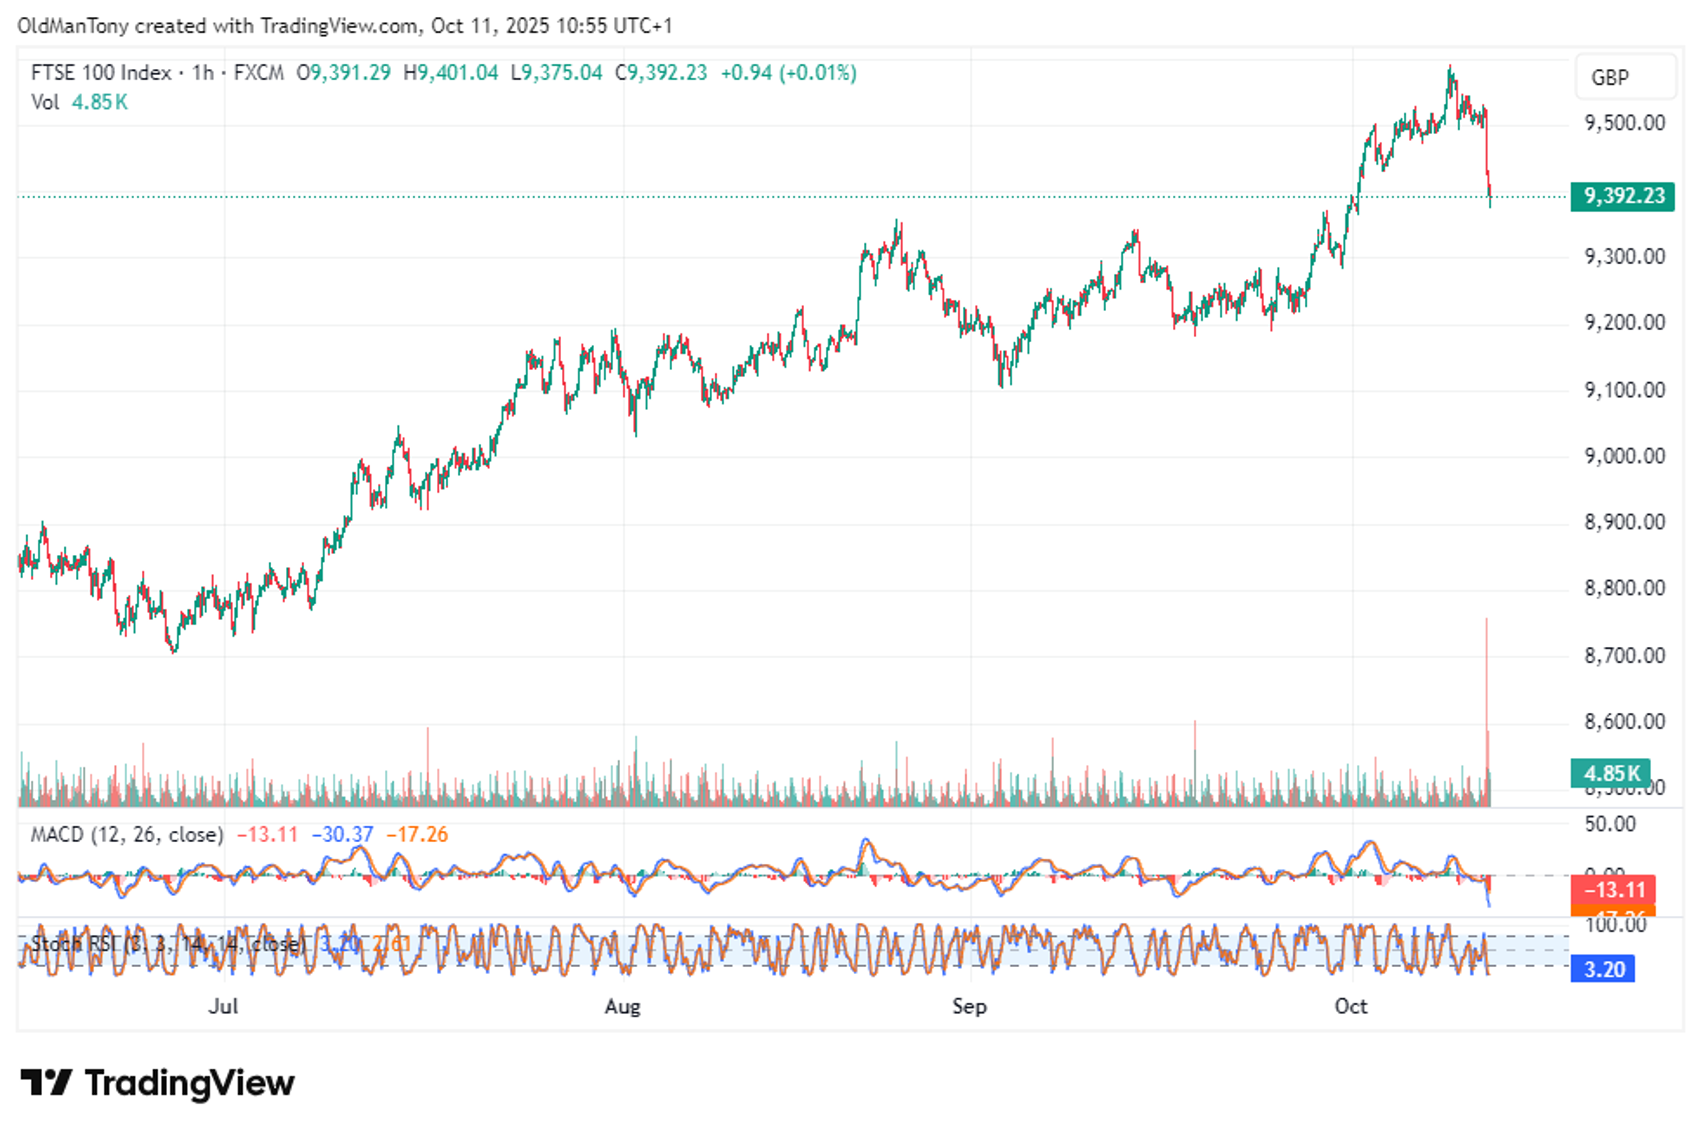
Chart Pattern & Trend: The FTSE has been in a solid uptrend since early October, climbing from around 9,200 to a recent peak near 9,550. However, on the hourly chart we're now seeing a concerning development—what appears to be a potential head and shoulders topping pattern forming at these highs. The left shoulder formed in early October, the head reached approximately 9,550, and we may be forming the right shoulder now. If this pattern completes with a break below the neckline around 9,350-9,380, it would be a significant bearish signal.
MACD: The MACD has rolled over sharply and is now at -13.11, deeply negative territory. This represents a notable shift in momentum after the sustained rally. The histogram bars are expanding to the downside, and we're seeing the steepest decline in months. This deterioration in momentum is a red flag that the uptrend may be exhausting itself.
Stochastics: Stochastics have dropped to very low levels at 3.20, indicating extreme oversold conditions on this short timeframe. While this suggests a potential bounce could materialize soon, the speed of the decline into oversold territory is concerning and often indicates strong selling pressure.
Elliott Wave Perspective: The rally from October lows appears to be a five-wave structure that may have completed at the recent highs, potentially marking the end of an extended wave.
Conclusion: Potential head and shoulders top forming. Momentum deteriorating sharply. Watch 9,350 neckline support—break would confirm reversal.
Tesla
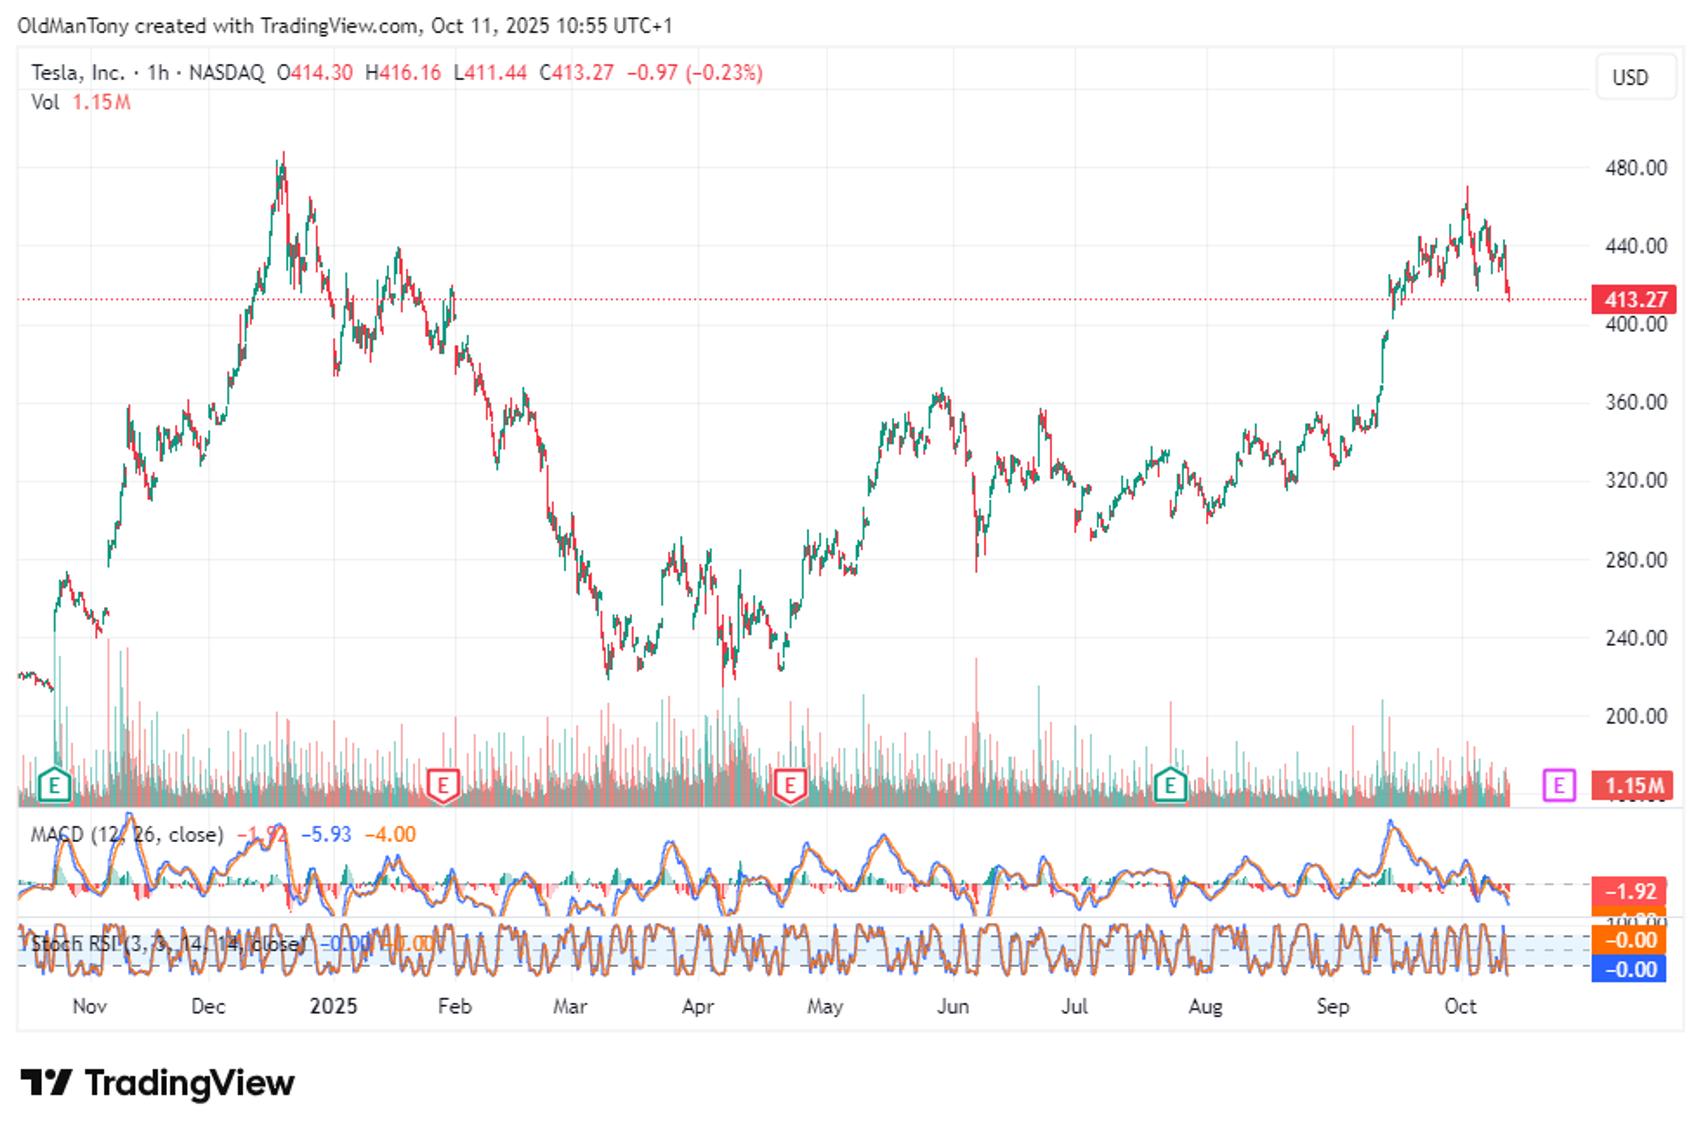
Chart Pattern & Trend: Tesla has been quite volatile throughout 2025, ranging between roughly $220 and $480. We're seeing a clear pattern of higher lows since the March bottom, but what's immediately striking is the recent double-top formation around the $475-480 level from December 2024 and October 2025. The stock has now rolled over from these highs and broken below short-term support. The earnings report markers (E) on the chart show significant volatility around these events, which isn't surprising for Tesla. The current price action suggests we're in the early stages of a pullback from the recent highs.
MACD: The MACD is printing at -1.92, in negative territory with both lines trending downward. We're seeing a clear bearish crossover that developed after the October peak. The momentum has shifted decidedly bearish on this timeframe, though we're not yet at extreme levels seen during previous major corrections in February or March.
Stochastics: Stochastics are hovering right at the zero line (0.00), indicating deeply oversold conditions. Tesla has a history of sharp moves, and these extreme readings often precede near-term bounces. However, they can also stay pinned at extremes during strong trending moves.
Elliott Wave Perspective: The rally from September appears corrective in nature, possibly an A-B-C structure that's now complete. We may be starting a new leg down within a larger corrective pattern.
Conclusion: Double-top reversal in play with momentum deteriorating. Oversold short-term but trend weakening. Watch $400 support level closely.
Glossary
Stochastic RSI (StochRSI)
The Stochastic RSI is a momentum indicator that combines the Stochastic Oscillator and the Relative Strength Index (RSI) to measure the speed and direction of price movements. It is primarily used to identify overbought or oversold conditions, helping traders anticipate potential trend reversals. By focusing on the relative position of the RSI within its recent range, StochRSI offers more sensitivity to price changes, making it ideal for spotting short-term trading opportunities.
MACD (Moving Average Convergence Divergence)
The MACD is a trend-following and momentum indicator that highlights changes in an asset's strength, direction, and duration. By comparing short-term and long-term moving averages, the MACD helps traders identify potential buy or sell signals and confirm the overall trend. Its histogram visually represents momentum, making it useful for gauging the strength of market moves and spotting potential reversals or continuations.
Elliot Wave
Elliott Wave Theory, developed by Ralph Nelson Elliott in the 1930s, is a technical analysis tool that predicts market price movements through repetitive patterns called waves, driven by investor psychology. It suggests prices move in a cycle of eight waves: a 5-wave impulsive structure in the direction of the main trend (Wave 1 starts the trend, Wave 2 pulls back, Wave 3 is the strongest, Wave 4 pulls back again, and Wave 5 completes the trend), followed by a 3-wave corrective structure (Wave A moves against the trend, Wave B bounces, and Wave C moves against the trend again). These patterns repeat across different time scales, reflecting market sentiment swings between optimism and pessimism. By identifying these waves, traders can anticipate price movements and make better decisions on when to buy or sell.
Join us next week, for more market insights.
Happy trading,
SGT Trading Desk
Disclaimer: This article is for educational purposes only and should not be considered financial advice. Market conditions can change rapidly, and trading involves significant risk.
Follow us, and keep yourself up to date with news and views about what's going on in the world's financial markets.
Latest News

A Blue Wave, a Red-Faced President and an AI Hangover

THE AI PARTY STUMBLES, OIL BOILS, AND CENTRAL BANKS KEEP EVERYONE GUESSING

Election Fever, Dollar Strength and That AI IPO
