
SGT Chart Book: Caution Returns as Summer Rally Hits a Speed Bump
Market Overview
Last week served up a reality check for markets that had been riding high through most of the summer. A perfect storm of disappointing data and political uncertainty sent investors scrambling for the exits, with risk assets taking it on the chin across the board.
The damage was pretty widespread - the S&P 500 dropped 2.3%, the Nasdaq fell 2.2%, and the Dow got hit hardest with a 2.9% decline. European markets had it even worse, with the DAX getting crushed for 4.5% and France's CAC 40 losing over 5%. The FTSE 100 showed some British resilience, only giving up 1.8%, but defensive sectors were the clear winners as everyone dialled back their risk appetite.
Currency markets told an interesting story too. The dollar found its mojo again despite some weaker domestic data, with EUR/USD dropping 1.5% and cable falling 1.3%. The yen took another beating against the greenback, sliding 2.3% as safe-haven flows seemed to favour dollars over everything else.
Commodities were mixed but most generally held up better than expected. Gold caught a bid, up 2% as real yields fell and geopolitical worries crept back in. Copper values completely collapsed as those who had been squeezing the front month based on Tariff expectations found themselves on the wrong side of the equation. Oil was basically flat after some mixed inventory data.
The crypto space stayed relatively calm, with Bitcoin grinding between $115K-$120K until profit-taking prompted a sell-off on Friday, with the weakness spilling into other coins.
So, what spooked everyone? The July jobs report was a real dud - only 73,000 new jobs and unemployment ticking up to 4.2%. Then President Trump threw another curveball with fresh tariff announcements targeting dozens of countries, which obviously didn't help the global trade outlook. The Fed held steady at 4.25-4.50% but hinted at possible cuts later in 2025, adding to the uncertainty.
Looking ahead to this week, we've got some heavy hitters reporting - Microsoft, Meta, AMD, and Caterpillar could all move the needle if they deliver. Data-wise, ISM Services and trade balance numbers will tell us whether that jobs weakness is spreading to other parts of the economy.
Bottom line: the summer party might be taking a breather, but strong earnings or steady data could easily get things back on track.
Introduction to our Chart Book
In this dynamic and uncertain market environment, our technical analysis aims to provide investors with a clear, data-driven framework to navigate volatility and make informed decisions. By examining price patterns, momentum indicators, and market trends across equities, commodities, and indices, this analysis identifies critical support and resistance levels, potential reversals, and emerging opportunities. Leveraging tools like Elliott Wave theory, MACD, and Stochastics, we offer actionable insights that help investors time their entries and exits more effectively, manage risk, and capitalize on short- and medium-term market movements. In a landscape shaped by trade tensions, inflation fears, and shifting economic outlooks, this technical approach equips investors with the precision and confidence needed to optimize their strategies and achieve better outcomes.
Our Technical Analysis
(Note: we are using 4-hourly charts)
EURUSD
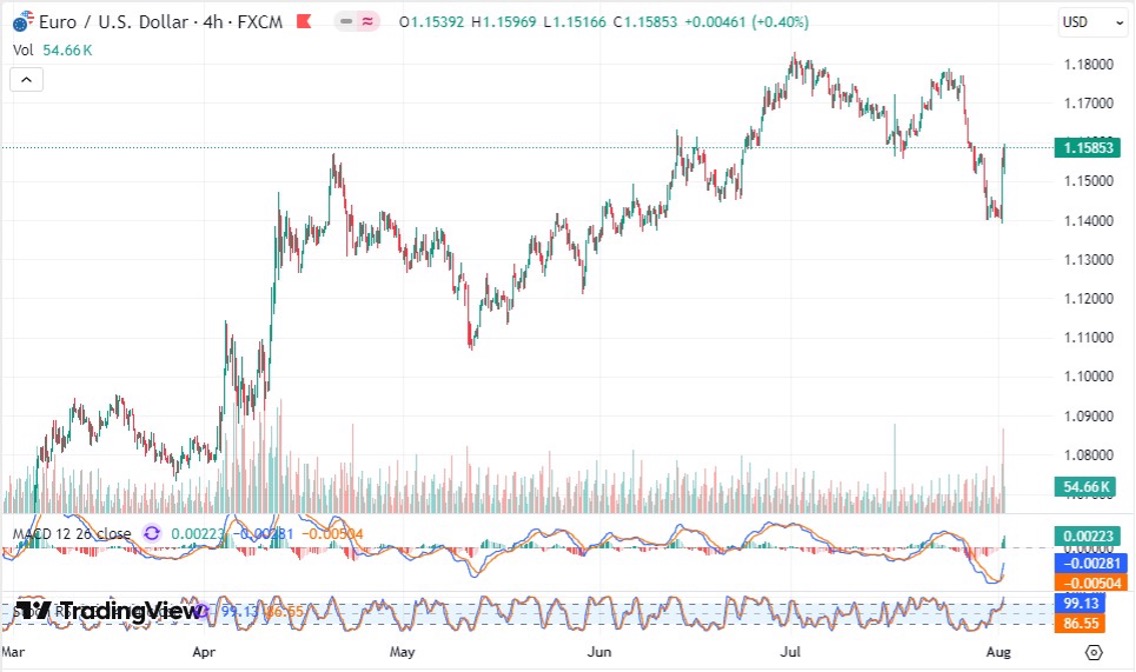
Looking at this EUR/USD 4-hour chart, I'm seeing a pretty bearish setup that's got my attention.
The most obvious pattern here is what looks like a bearish flag or pennant that's been forming since those July highs around 1.18. We had that strong sell-off from the peak, followed by this consolidation phase that's now breaking lower - classic textbook stuff.
The recent break below 1.155 support is significant, and we're currently testing that level as resistance. If it holds, I'd expect continued downside pressure toward 1.145-1.140 area.
From a MACD perspective, we're seeing bearish divergence on the recent highs, and the histogram is clearly turning negative. The signal line crossover happened a few sessions back, confirming the momentum shift.
Stochastics are oversold but haven't shown any meaningful bounce yet - sometimes these can stay oversold longer than expected in trending moves.
As for Elliott Wave, this looks like we completed a 5-wave move up into July, and we're now in what appears to be a corrective A-B-C pattern down. If that's correct, we might be in the final C-wave lower.
The volume profile shows decent participation on the breakdown, which adds credibility to the move.
Risk management is key here - any reclaim above 1.16 would make me question the bearish thesis. But for now, the path of least resistance seems lower, with 1.145 as my next target.
Overall sentiment: Bearish bias, watching for continuation below current levels.
S&P 500
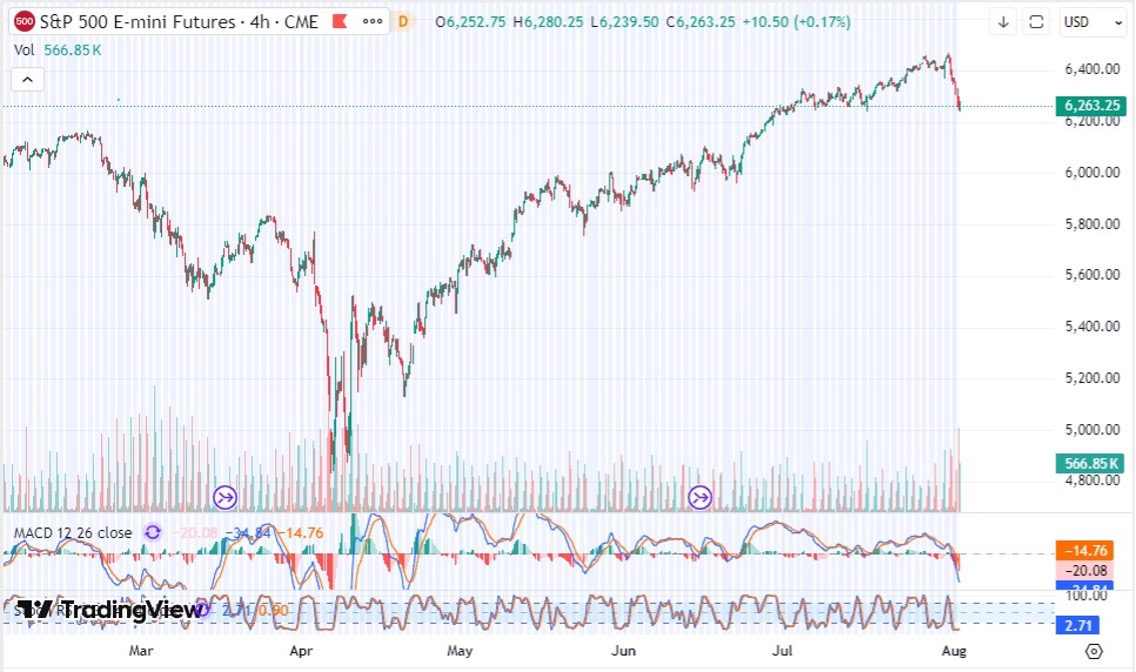
This S&P 500 E-mini chart is showing some serious warning signs that have me concerned about the near-term outlook.
What jumps out immediately is the massive shooting star/doji formation we're seeing at these all-time highs around 6,400. That's textbook reversal action, especially after such an extended run from the April lows. We've basically stalled right at a major psychological level.
The pattern that's developing looks like a potential double top or even a broader topping formation. We hit highs in July, pulled back, then made another attempt that failed to sustain - that's not the behaviour you want to see in a healthy uptrend.
MACD is telling a clear story here - we've got significant bearish divergence on these recent highs. The histogram has turned negative and we're seeing the signal lines starting to cross over. This momentum deterioration usually precedes price action by a few sessions.
Stochastics are rolling over from overbought territory, which confirms the momentum shift. When you see both oscillators agreeing like this, it's worth paying attention.
From an Elliott Wave perspective, this looks like we might have completed a 5-wave impulse from the April lows, and we could be starting a corrective wave sequence. The current weakness might be wave A of an A-B-C correction.
Volume has been lacklustre on the recent highs, which is another red flag. You want to see expansion on breakouts, not this kind of distribution.
First support comes in around 6,200, but if this is a real reversal, 6,000 isn't out of the question.
Overall: Cautiously bearish, watching for follow-through below 6,250.
Bitcoin (BTC/USD)
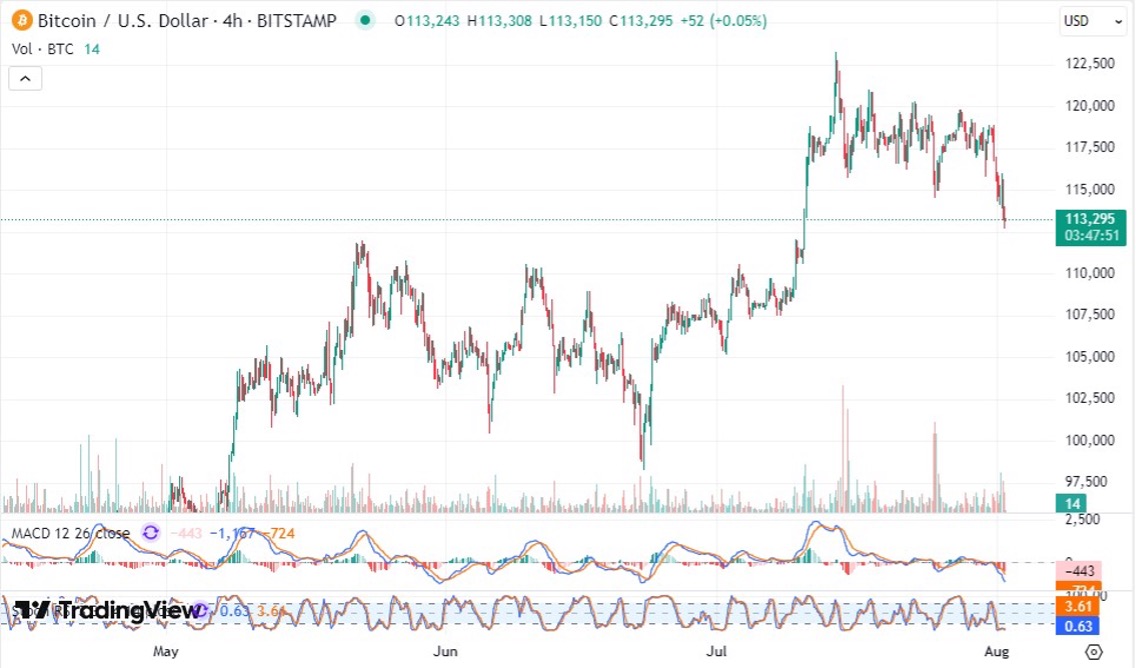
Looking at this Bitcoin chart, I'm seeing a pretty concerning technical breakdown that's got my attention focused on the downside.
The most glaring pattern here is what appears to be a failed breakout above that critical $120K resistance level. We spiked up there in July, couldn't hold it, and now we're seeing some serious follow-through selling. That's classic distribution behaviour - smart money unloading into strength.
What's particularly worrying is how we've broken below that horizontal support around $115K that had been holding since early July. When key levels like that give way, it often leads to accelerated selling as stop losses get triggered.
The current price action looks like we might be forming a broader head and shoulders pattern, with the July spike being the head. If that plays out, we could see a measured move down toward the $105K-$107K area.
MACD is painting a pretty clear picture - we've got negative momentum building and the histogram is expanding to the downside. The signal line crossover happened recently and there's no sign of it bottoming yet.
Stochastics are oversold but showing no signs of turning higher. In crypto, these can stay oversold for extended periods during trending moves, so I wouldn't rely on them for timing a bounce just yet.
From an Elliott Wave perspective, this looks like we might be in a corrective C-wave lower after completing an impulse move up.
Volume on the breakdown has been decent, which gives the move more credibility.
Next support targets: $110K, then $105K if that fails.
Overall bias: Bearish until we reclaim $115K convincingly.
Oil (WTI Crude)
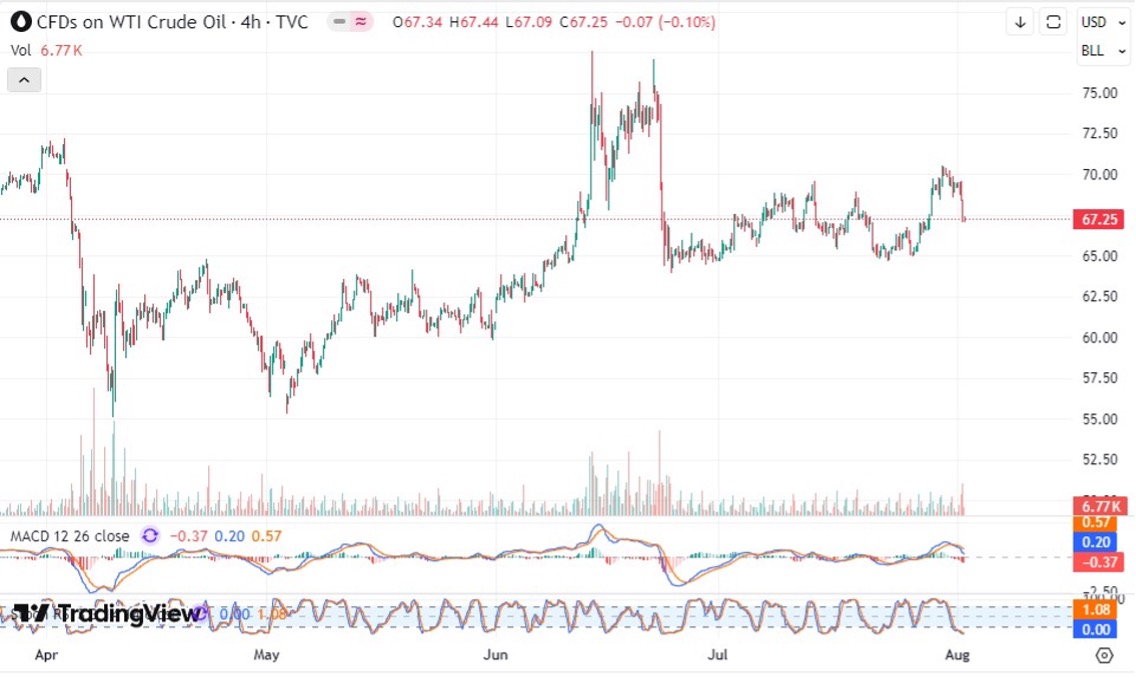
This WTI crude oil chart is showing some mixed signals, but I'm leaning slightly bearish on the near-term setup.
The dominant pattern here is a clear trading range that's been in place since that massive spike and reversal in June. We've been grinding between roughly $65-$71 for the past couple months, which tells me the market is having trouble finding direction after that initial volatility.
What's concerning is that we keep failing at the upper end of this range. We've tested that $70-71 resistance multiple times now and can't seem to break through with any conviction. That June spike to around $76 looks more and more like a false breakout that trapped bulls.
Currently sitting right in the middle of this range around $67, but the recent price action suggests we might be gravitating toward the lower bound. The failure at $71 last week was pretty decisive.
MACD is telling an interesting story - we're seeing some minor bearish divergence on the recent highs, and the histogram is starting to roll over. It's not screaming sell, but it's certainly not bullish either.
Stochastics are neutral to slightly bearish, sitting in that middle zone where they could go either way. Not much help from this indicator right now.
From an Elliott Wave perspective, this looks like we might be in a complex corrective pattern after that June spike. Could be a triangle or flat correction that's still working itself out.
The volume profile has been pretty anaemic during this consolidation, which suggests indecision.
If we break $65, I'd target $62-63. Upside, we need to clear $71 convincingly.
Overall: Neutral to bearish bias within the range.
Gold (XAU/USD)
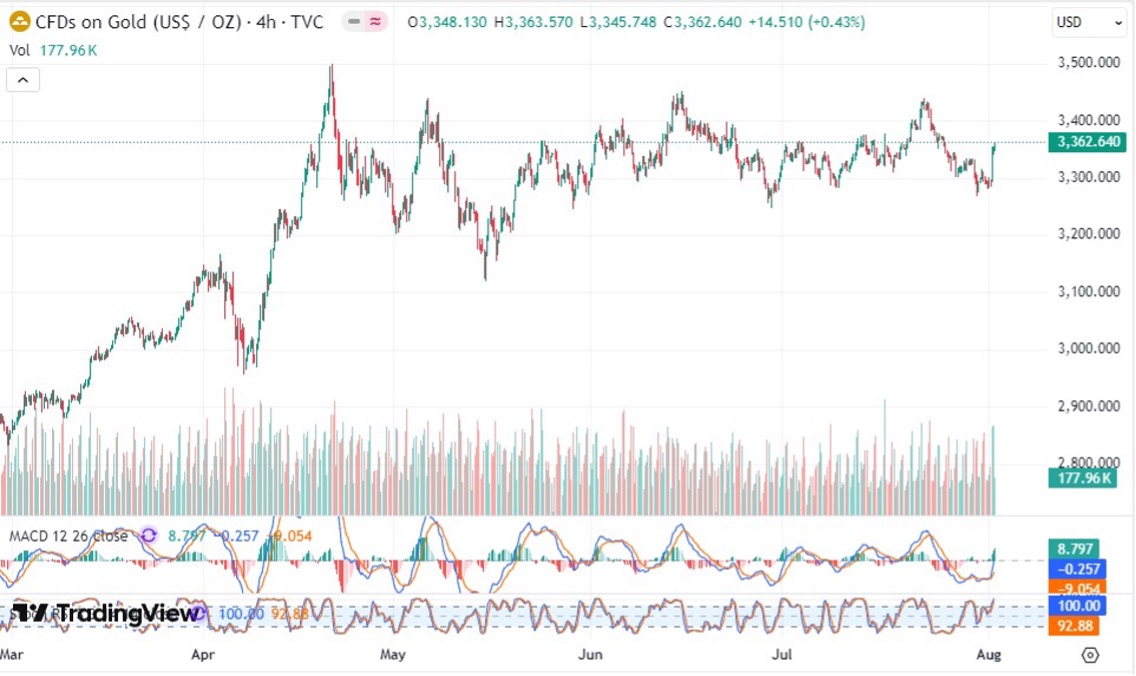
This gold chart is showing some classic consolidation behaviour that's got me watching for the next directional move.
What I'm seeing here is a pretty well-defined trading range that's been in play since late April. We've got solid resistance around $3,450-$3,500 and support down near $3,200-$3,250. Gold's been grinding sideways in this $250-300 range for months now, which is actually pretty typical behaviour after a strong trending move.
The recent price action has me slightly concerned though. We've tested that upper resistance multiple times - in May, June, July, and again recently - but can't seem to break through with any real conviction. Each rejection has been met with selling pressure back toward the middle of the range.
Currently sitting around $3,362, we're right in the thick of this consolidation zone. The fact that we're not holding closer to the highs after multiple attempts suggests the path of least resistance might be lower in the near term.
MACD is telling a neutral to slightly bearish story. We're seeing some minor negative divergence on the recent highs, and the histogram has been trending lower. Not screaming sell, but definitely not bullish momentum.
Stochastics are in that middle zone where they could break either way - not much help from this indicator right now.
From an Elliott Wave perspective, this looks like a complex sideways correction after the strong move up from March. Could be working on a triangle or flat pattern.
If we break $3,300, I'd watch $3,200. Upside, need to see $3,450 taken out convincingly.
Overall: Neutral with slight bearish bias within the range.
UK100 Index
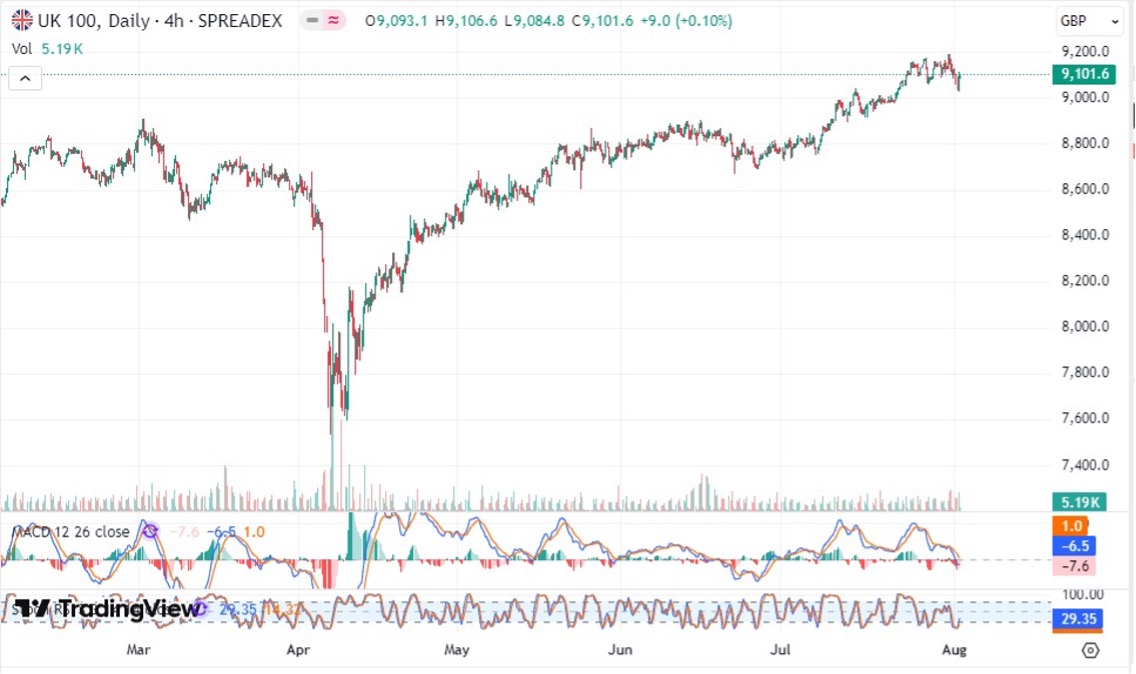
This FTSE 100 chart is showing some textbook topping action that's got me pretty concerned about the near-term direction.
What really stands out here is the clear distribution pattern we've been seeing since those July highs around 9,200. We made new all-time highs but couldn't sustain them, and now we're seeing some methodical selling pressure that's broken us below key support levels.
The pattern looks like a classic rounded top or potential head and shoulders formation. We had that initial peak in July, some backing and filling, then failed to make a meaningful new high before rolling over. That's not the kind of price action you want to see at these elevated levels.
What's particularly worrying is how we've broken below that 9,000 psychological level that had been acting as support. When round numbers like that give way, it often leads to accelerated selling as retail stops get triggered.
The current price action around 9,100 looks like we might be getting a weak bounce or retest of broken support, but the overall momentum feels decidedly bearish.
MACD is telling a pretty clear story - we've got significant bearish divergence on those July highs, and the momentum indicators have been rolling over for weeks. The histogram is expanding to the downside with no signs of bottoming.
Stochastics are oversold but haven't shown any meaningful reversal signals yet. These can stay oversold longer than expected during trending moves.
From an Elliott Wave perspective, this looks like we completed an extended 5-wave move up and we're now in the early stages of a corrective sequence.
Next support: 8,800-8,900 area.
Overall: Bearish bias, watching for continuation lower.
Tesla
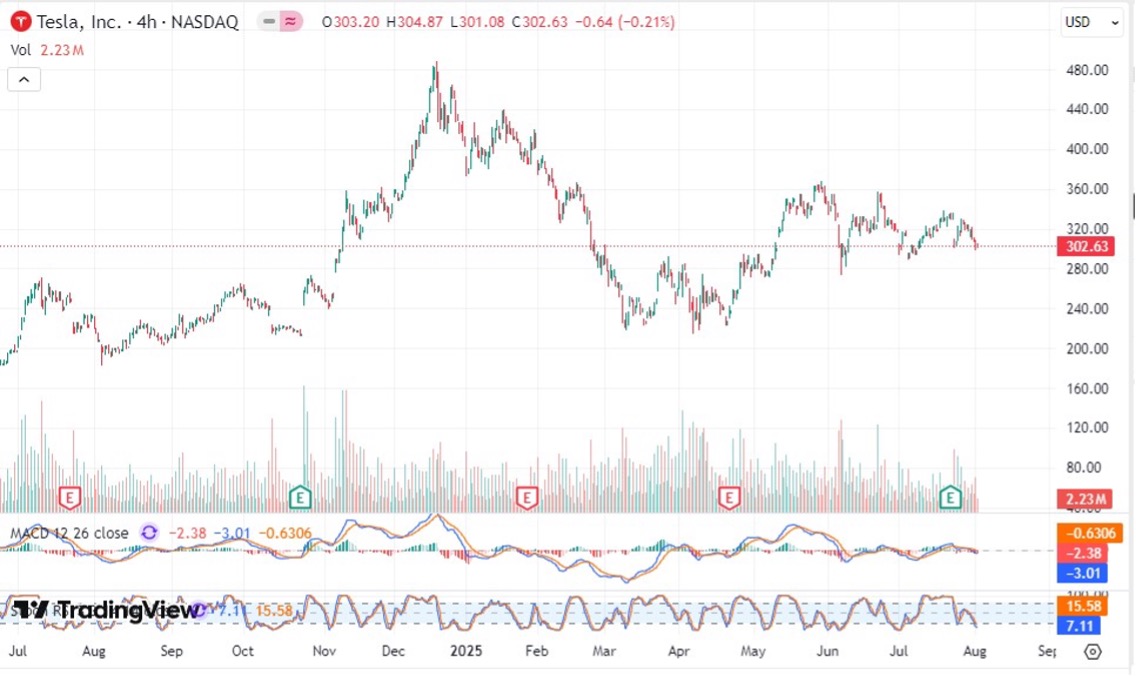
This Tesla chart is showing some pretty concerning technical deterioration that's got me leaning bearish on the stock.
The most obvious pattern here is what looks like a massive head and shoulders formation that's been playing out over the past year. We had that parabolic spike to nearly $500 back in December/January - that's clearly the head - with lower highs on either side forming the shoulders. The neckline of this pattern sits around $240-250, and we've been testing it repeatedly.
What's particularly worrying is how we keep failing at these lower highs. Each bounce attempt since that January peak has been weaker than the last, which tells me the buying interest is drying up. The recent rally to around $370 in July couldn't even get halfway back to those highs before rolling over again.
Currently trading around $302, we're sitting right in the danger zone. If we break below that $240 neckline decisively, the measured move from this head and shoulders pattern could target the $150-180 area - that's some serious downside potential.
MACD has been telling a bearish story for months now. We've got persistent negative momentum and the recent attempts to turn positive have failed quickly. The histogram keeps making lower highs, which confirms the weakening momentum.
Stochastics are in that middle zone but trending lower, suggesting more downside pressure is building.
From an Elliott Wave perspective, this looks like we completed a massive 5-wave impulse into those January highs, and we're now working through what could be a significant A-B-C correction.
Risk/reward favours the bears here until we see some real change in character.
Overall: Bearish bias, watching $240 closely.
Glossary
Stochastic RSI (StochRSI)
The Stochastic RSI is a momentum indicator that combines the Stochastic Oscillator and the Relative Strength Index (RSI) to measure the speed and direction of price movements. It is primarily used to identify overbought or oversold conditions, helping traders anticipate potential trend reversals. By focusing on the relative position of the RSI within its recent range, StochRSI offers more sensitivity to price changes, making it ideal for spotting short-term trading opportunities.
MACD (Moving Average Convergence Divergence)
The MACD is a trend-following and momentum indicator that highlights changes in an asset's strength, direction, and duration. By comparing short-term and long-term moving averages, the MACD helps traders identify potential buy or sell signals and confirm the overall trend. Its histogram visually represents momentum, making it useful for gauging the strength of market moves and spotting potential reversals or continuations.
Elliot Wave
Elliott Wave Theory, developed by Ralph Nelson Elliott in the 1930s, is a technical analysis tool that predicts market price movements through repetitive patterns called waves, driven by investor psychology. It suggests prices move in a cycle of eight waves: a 5-wave impulsive structure in the direction of the main trend (Wave 1 starts the trend, Wave 2 pulls back, Wave 3 is the strongest, Wave 4 pulls back again, and Wave 5 completes the trend), followed by a 3-wave corrective structure (Wave A moves against the trend, Wave B bounces, and Wave C moves against the trend again). These patterns repeat across different time scales, reflecting market sentiment swings between optimism and pessimism. By identifying these waves, traders can anticipate price movements and make better decisions on when to buy or sell.
Join us next week, for more market insights.
Happy trading,
SGT Trading Desk
Disclaimer: This article is for educational purposes only and should not be considered financial advice. Market conditions can change rapidly, and trading involves significant risk.
Follow us, and keep yourself up to date with news and views about what's going on in the world's financial markets.
Latest News

The Anatomy of the Perp Basis: How Funding Rates Drive Crypto Liquidity and Cascades

Widening Gaps

Bonds Are Screaming, Stocks Are Smiling – Something Has to Give