
Stocks Up, Yields Up, Nerves Up – Welcome to Modern Markets
Chart Book for 28th of September 2026
The S&P 500 finished roughly 1.1% higher, while the Nasdaq jumped about 3.2%, helped once again by enthusiasm surrounding AI and technology. Monday’s 1.5% S&P rally set the tone, although soaring Treasury yields later in the week provided a fairly brutal reminder that interest rates haven’t disappeared as a problem. The US 10-year yield briefly pushed above 5% as September business activity hit its strongest level in more than five years.
That strength reinforced expectations that the Fed may tighten again. The dollar responded accordingly, pushing EUR/USD towards 1.1360, despite surprisingly resilient Eurozone PMI numbers. Both the Fed and ECB now appear more concerned about inflation than markets would ideally like.
Bitcoin enjoyed a considerably better week, trading around $84,000 after a strong rebound, helped by roughly $2.4 billion of weekly US spot-Bitcoin ETF inflows. Crypto enthusiasm is returning, although we’re hardly back to carefree territory yet.
Oil remained the geopolitical barometer. WTI slipped back towards $91, with Friday seeing another sharp decline as hopes grew of progress between Washington and Tehran and Saudi crude flows improved.
Gold had a tougher time, falling roughly 2% on the week towards $4,300 as higher yields and a stronger dollar outweighed its traditional safe-haven appeal.
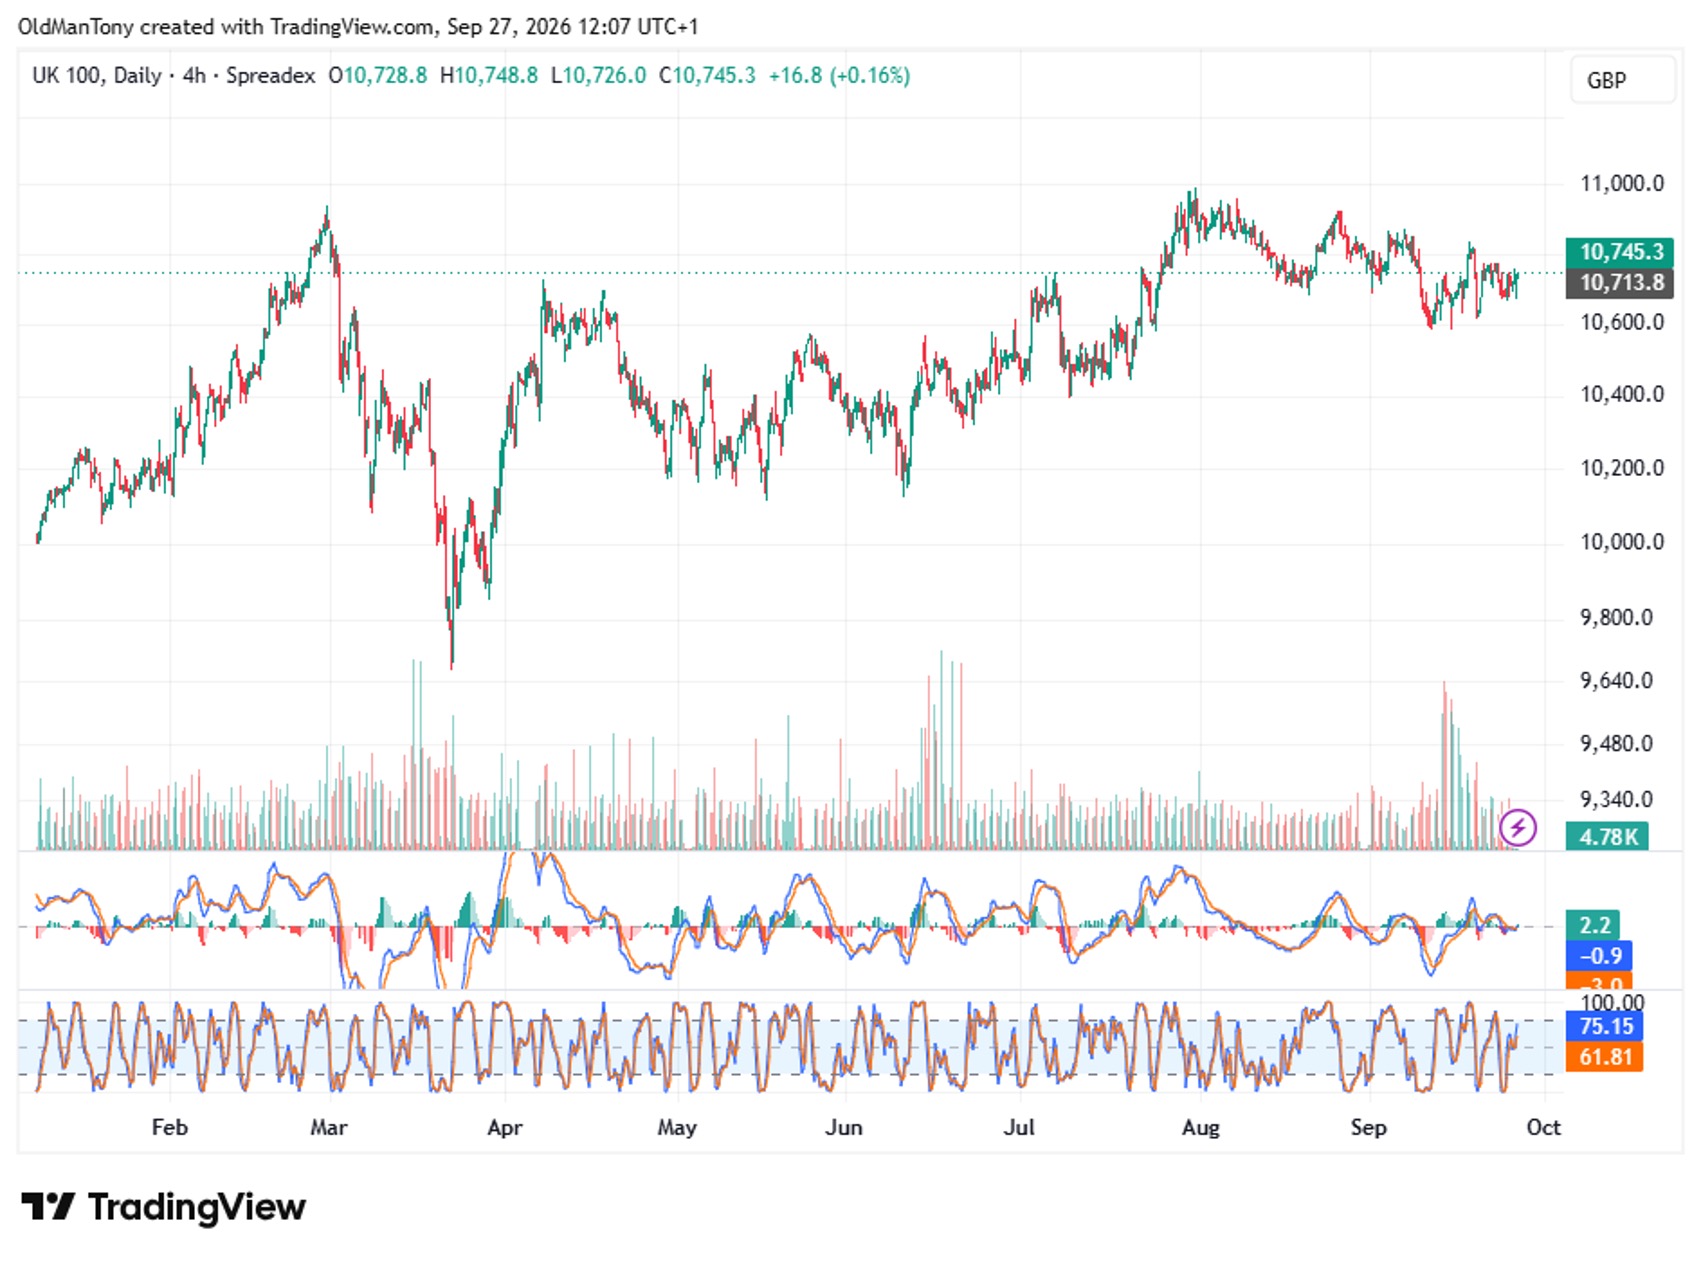
Meanwhile, the FTSE 100 recorded its second consecutive weekly gain, with banks and miners compensating for weaker energy shares. Tesla remained under pressure amid valuation concerns, while NVIDIA continued benefiting from relentless AI infrastructure spending and fresh demand for its latest chips.
Looking ahead, next week could be considerably livelier. US PCE inflation and Friday’s Non-Farm Payrolls are the big ones. Both will feed directly into the argument over another Fed hike.
For traders, I’d keep one eye firmly on Treasury yields, another on oil, and perhaps grow a third for the Fed. If yields keep climbing, equity optimism may finally have to answer some awkward questions.
Introduction to our Chart Book
In today’s volatile market environment, our technical analysis provides a clear, data-driven framework to support informed investment decisions. By evaluating price action, momentum indicators, and trend behavior across equities, commodities, and indices, we identify key support and resistance levels, reversal signals, and emerging opportunities. Using tools such as Elliott Wave theory, MACD, and Stochastics, we deliver actionable insights to improve trade timing, manage risk, and capture short- to medium-term market moves. This disciplined approach enhances precision and confidence for investors navigating shifting economic conditions.
Read on for our Technical Analysis:
EURUSD - 4 Hour Chart
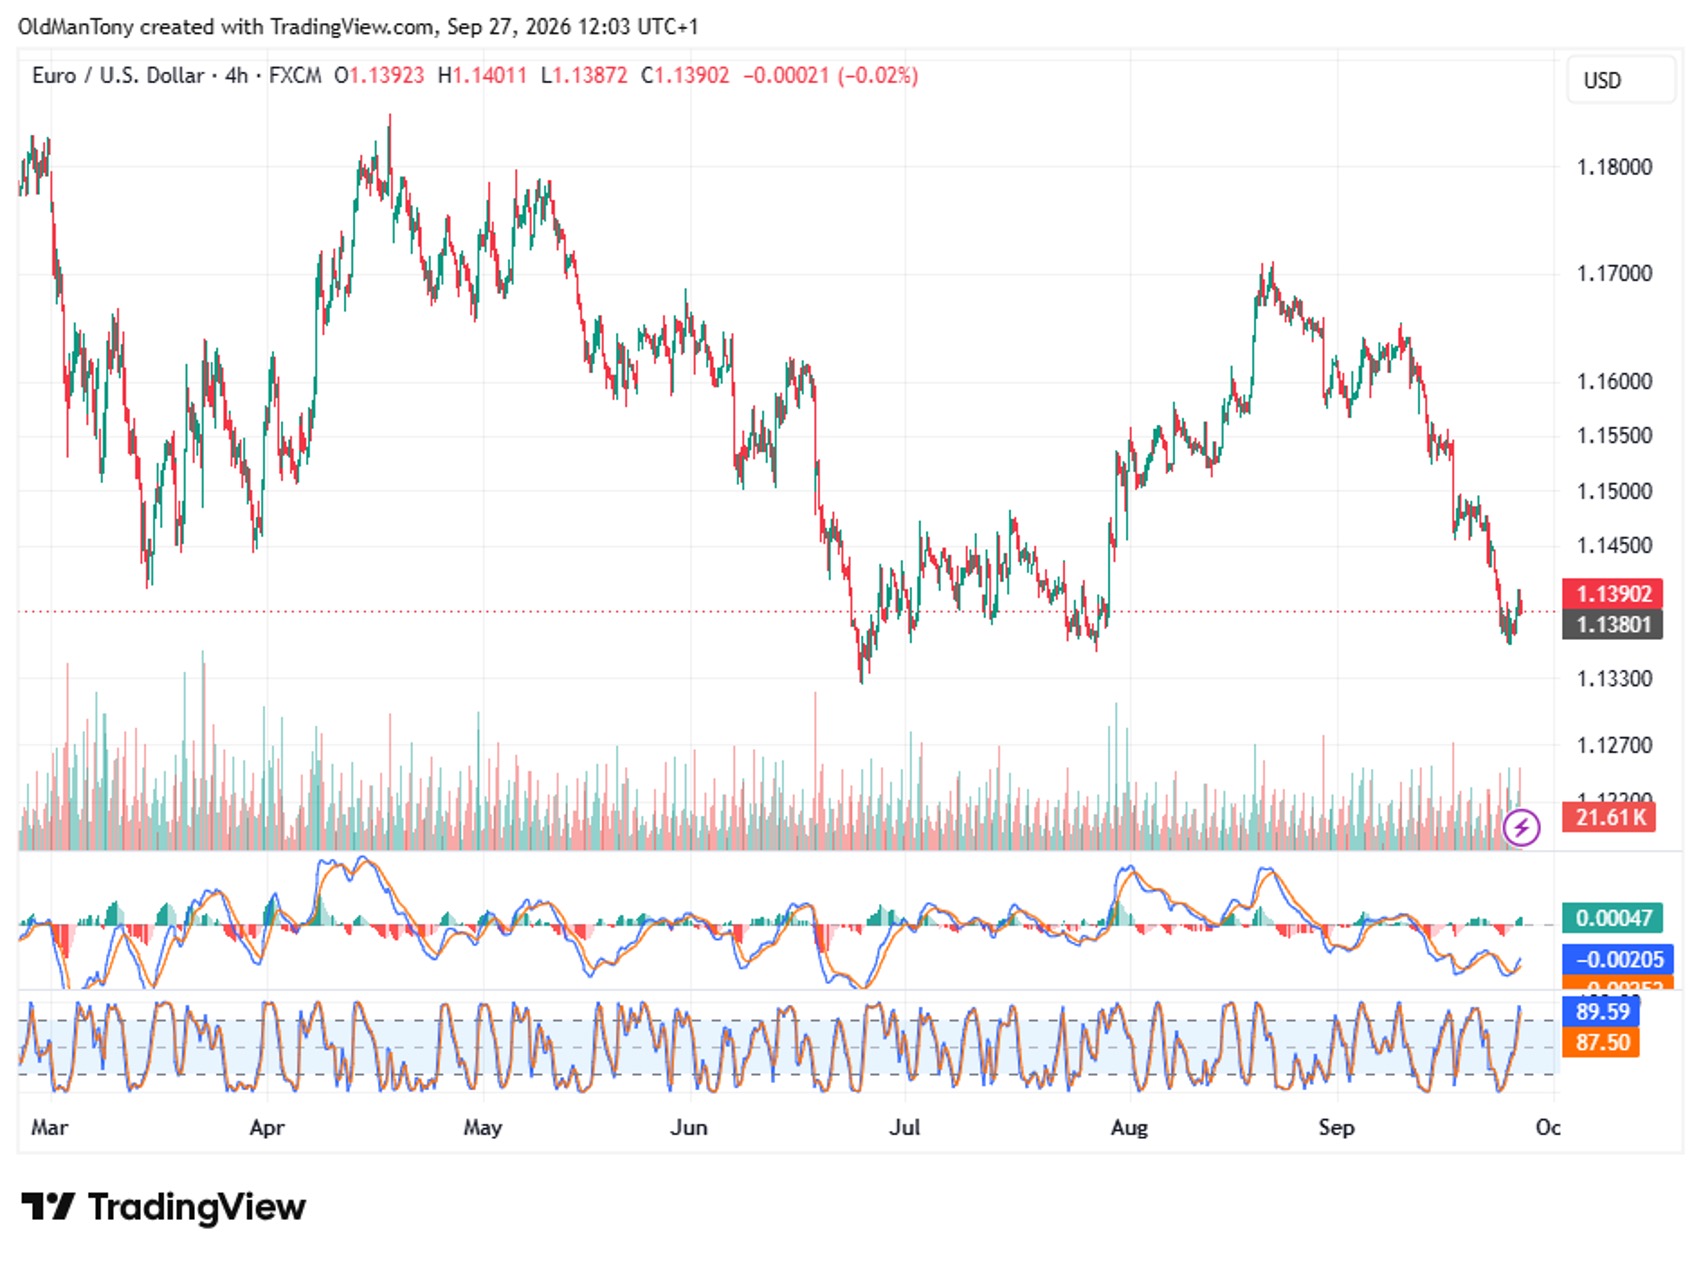
EUR/USD has deteriorated materially since last week's review. The pair has fallen from roughly 1.1490 to 1.1390, breaking several support areas along the way and reinforcing the sequence of lower highs and lower lows that began from August's 1.1700 region.
Immediate support sits around 1.1360–1.1380, where buyers have started appearing. Below there, 1.1330–1.1340 becomes critical, followed by 1.1270–1.1300. Resistance has moved down to 1.1420–1.1450, followed by 1.1500. We'd now regard 1.1550–1.1600 as major structural resistance rather than merely an intermediate hurdle. The overall pattern is clearly bearish, but the pair is becoming tactically stretched after a relatively persistent September decline.
MACD remains below zero, meaning the dominant momentum trend is still negative. However, the histogram has turned slightly positive, and the MACD line is curling upwards. That's an early indication that selling momentum may be exhausting itself around 1.1360.
Stochastic RSI tells the same story from another angle - perhaps rather dramatically. At roughly 90/88, it's now overbought following the tiny recovery from recent lows. That's unusual after such a strong decline and suggests the rebound itself may already be stretched. In other words, the broader trend remains down despite the oscillator bounce.
The Elliott count from the August high fits reasonably well with a five-wave decline. We could currently be finishing Wave 5, which would make a corrective A-B-C recovery increasingly likely. Alternatively, the latest bounce may merely be a small Wave 4 before another push lower.
For us, 1.1450 is now the first serious test. Below it, rallies remain selling opportunities from a purely technical perspective. Above 1.1500 we'd become more neutral.
Until then, the euro remains technically bruised, and the dollar has the upper hand.
S&P 500
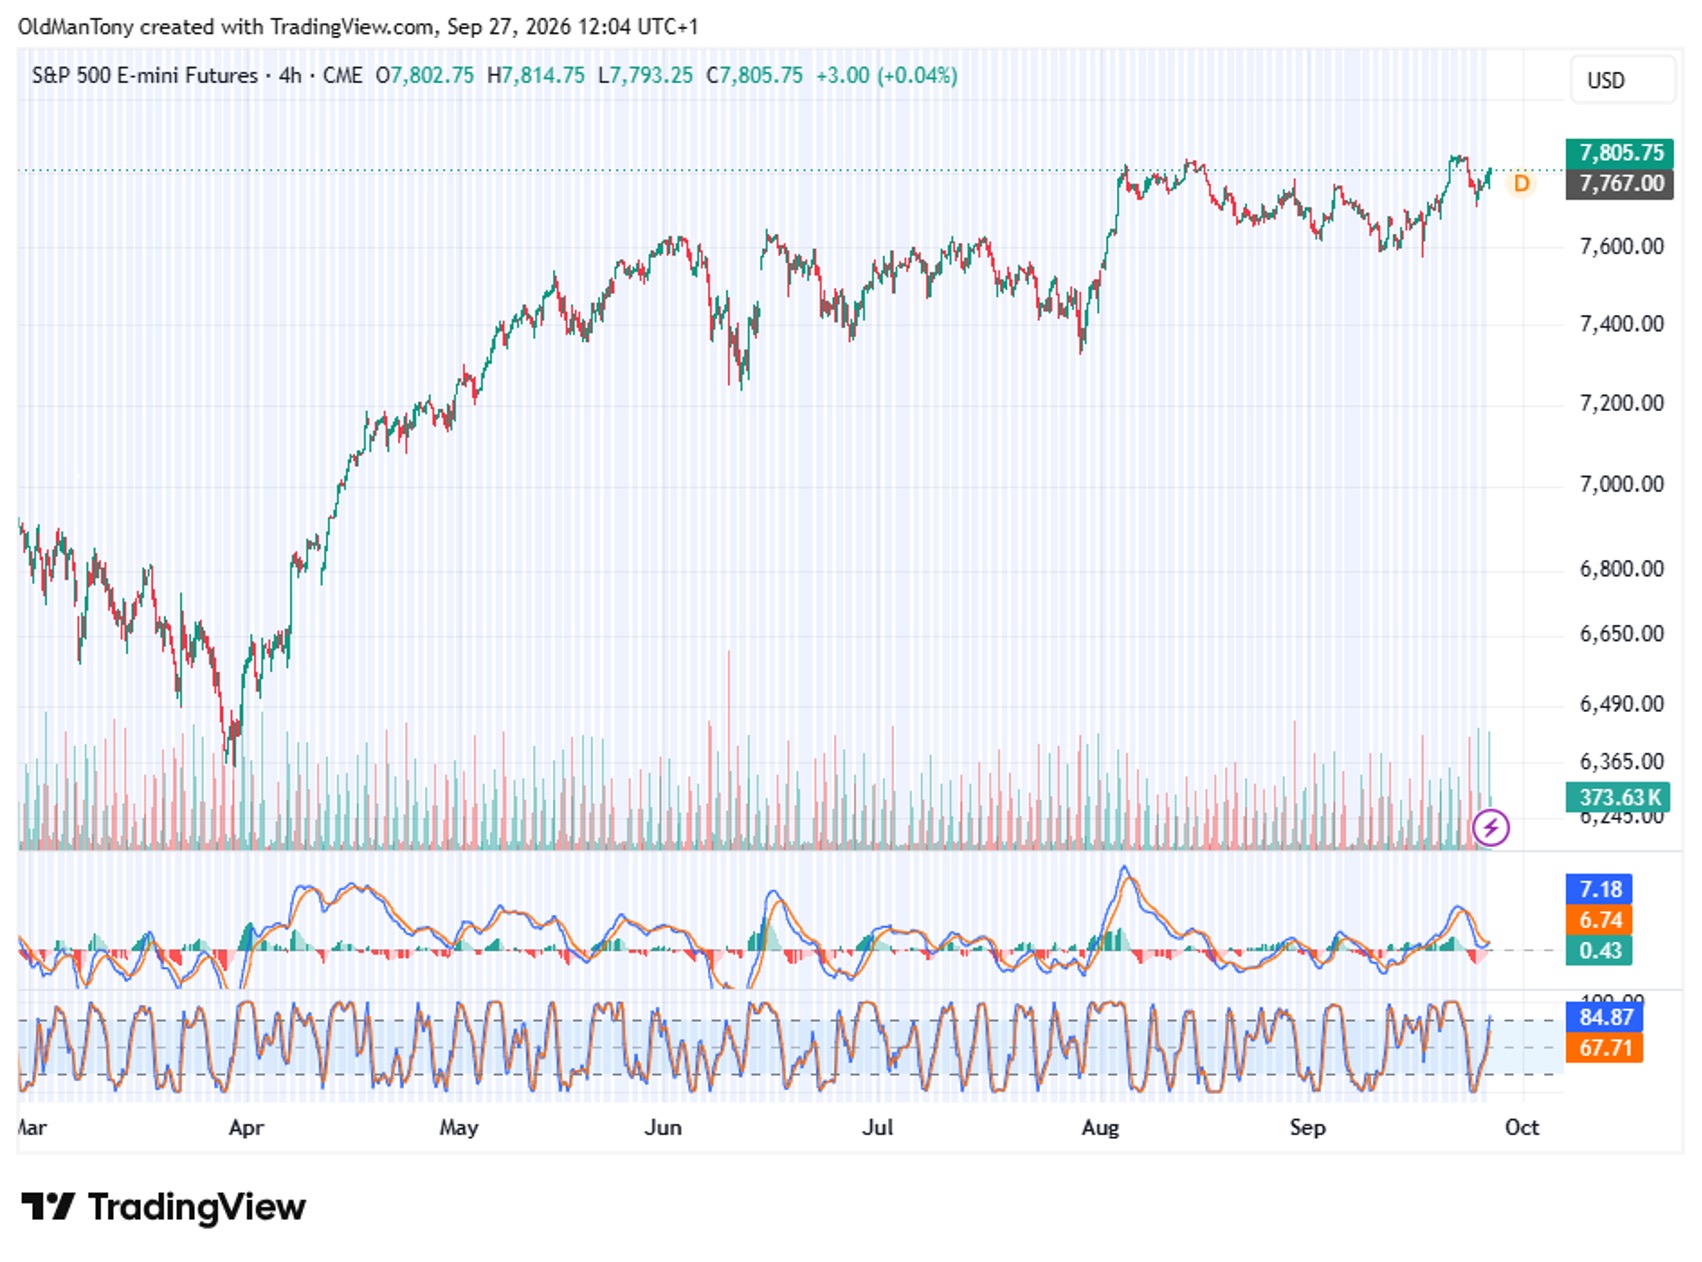
The S&P has done what it has repeatedly done throughout this cycle: wobble just enough to frighten everyone, then quietly wander back towards the highs. Price around 7,806 has now pushed beyond the resistance region we highlighted previously and is again testing record territory.
The immediate breakout zone sits roughly between 7,780 and 7,815. We're currently inside or marginally above it, meaning the next several candles matter. A sustained break could target 7,850, followed by 7,900 and eventually the big round 8,000 level. Support moves up towards 7,740–7,760, followed by 7,650–7,680. Below 7,600 we'd become considerably more cautious. The broader structure remains an unmistakable sequence of higher highs and higher lows from April. September's correction failed to break anything structurally significant and buyers returned aggressively.
MACD remains positive, with the MACD line around 7.18 versus 6.74, while the histogram is marginally above zero. Momentum therefore supports the breakout, although considerably less aggressively than during August's surge. We'd like to see MACD accelerate if price pushes materially beyond 7,800.
Stochastic RSI around 85/68 has moved into overbought territory. That's understandable given the latest rally but argues against blindly chasing strength. We'd prefer either confirmation above 7,815 or a controlled retest of breakout support.
From an Elliott perspective, we continue to see the April advance as an extended five-wave impulse. The current move could represent the final stages of Wave 5, possibly an extension within that wave.
That's important because late-stage Elliott advances can run much further than expected - but they can also reverse quickly once finished.
We remain bullish while 7,650–7,700 holds. The trend is still your friend. Just remember friends occasionally send you the bar bill.
Bitcoin (BTC/USD)
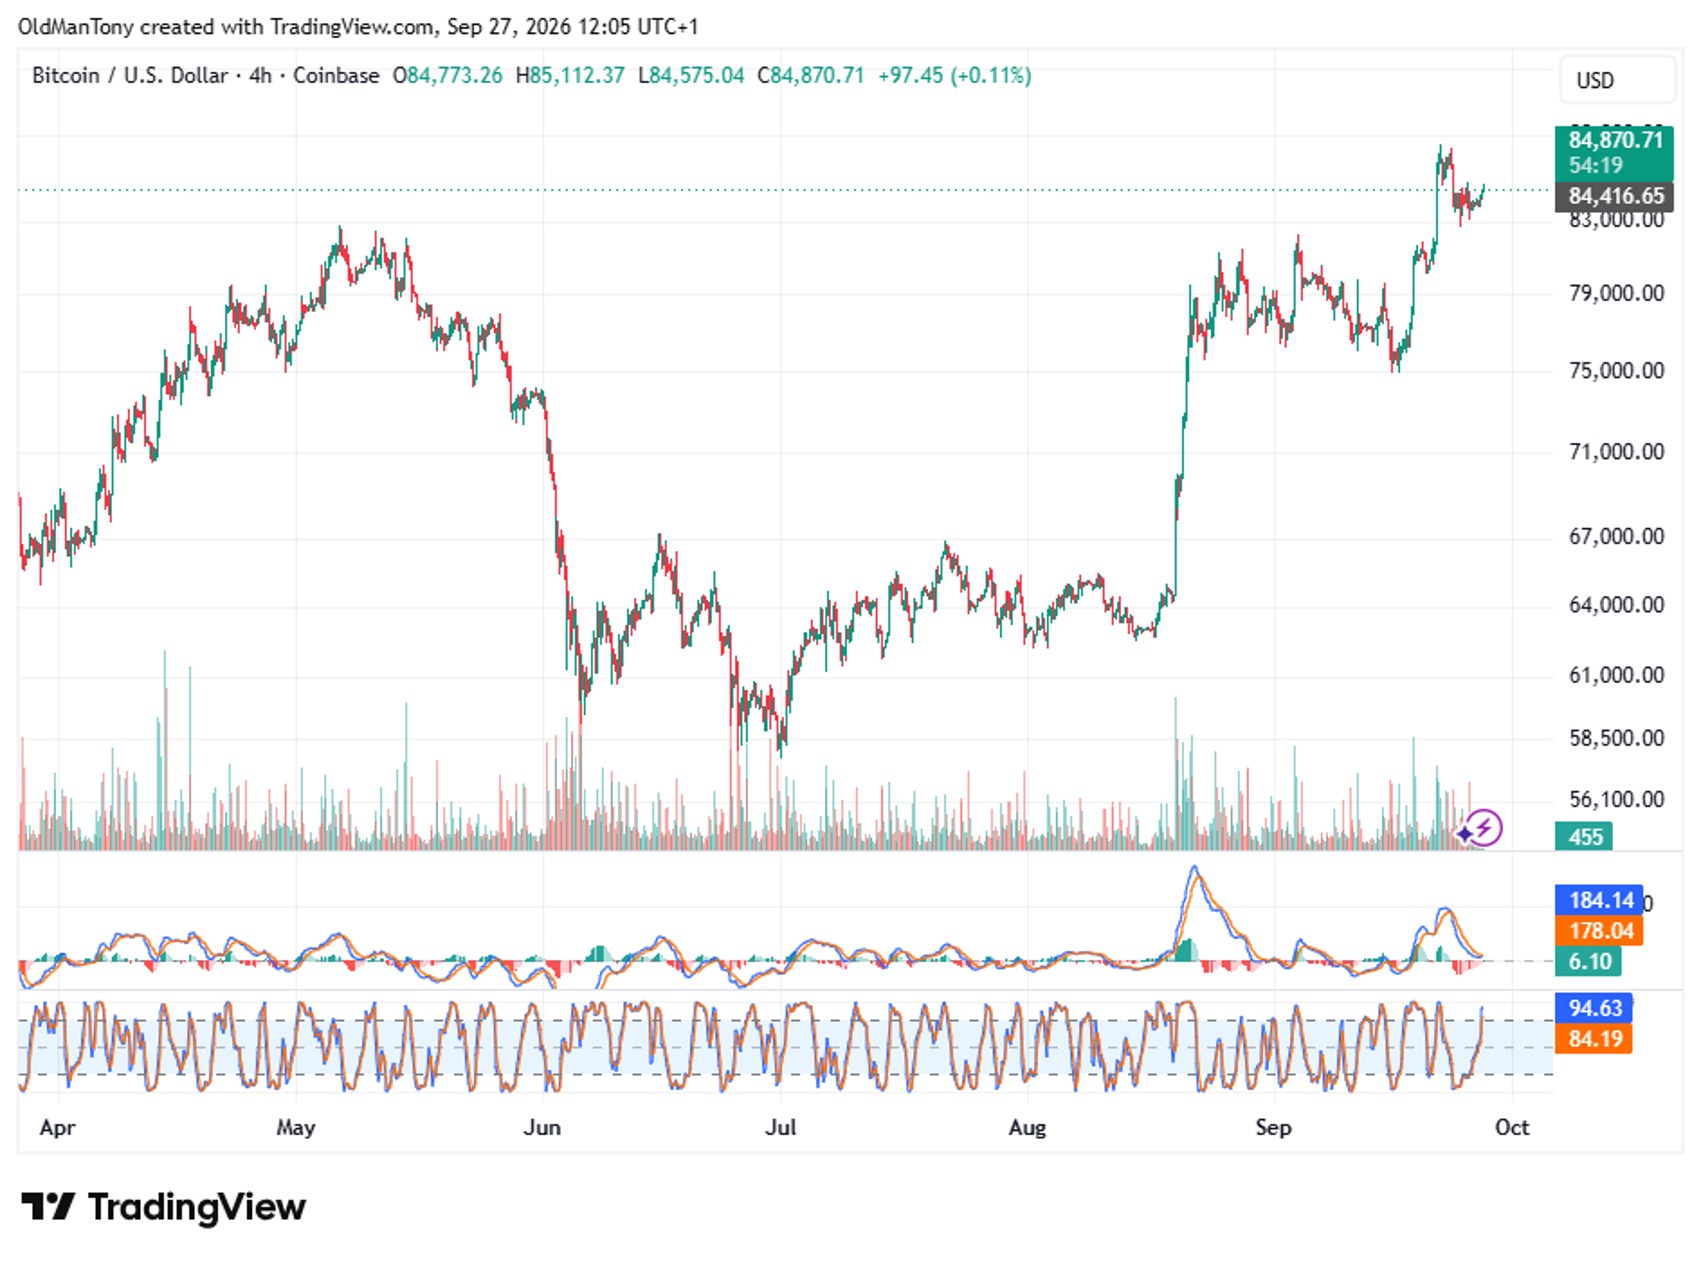
Bitcoin has delivered the breakout we were looking for last week. Price has pushed decisively through the former $81,000–82,000 ceiling, reached approximately $86,000 and is now consolidating around $84,900. Technically, that's exactly the sort of behaviour bulls wanted to see.
The previous breakout area around $82,000–83,000 should now act as first meaningful support. Beneath there, $79,000–80,000 becomes increasingly important. On the upside, resistance is initially around $85,500–86,000. Clearing that opens the possibility of $88,000 and then the psychologically obvious $90,000 region.
The bullish feature is that the pullback from the latest high has been relatively shallow. We're not seeing an immediate collapse back beneath the breakout level, which reduces the likelihood - at least for now - that this was simply a false break.
MACD remains positive, around 184 versus 178, and the histogram is still above zero. However, momentum has cooled sharply from its earlier surge. That's normal after a breakout but worth watching. If Bitcoin makes another high while MACD produces a materially lower high, we'd start looking for bearish divergence.
Stochastic RSI is extremely elevated at approximately 95/84. Bitcoin is clearly overbought on the four-hour timeframe. Again, overbought doesn't mean the market has to fall, but it makes chasing $85,000 much less attractive than buying a controlled retest.
Elliott-wise, the August surge looks like Wave 3, the August/September consolidation like Wave 4, and we're probably now inside the anticipated Wave 5.
We therefore remain technically bullish above $82,000, but we'd be wary of short-term overheating. Hold $82–83k and $88–90k remains feasible. Fall back beneath $80k and we'd reassess the breakout.
Oil (WTI Crude)
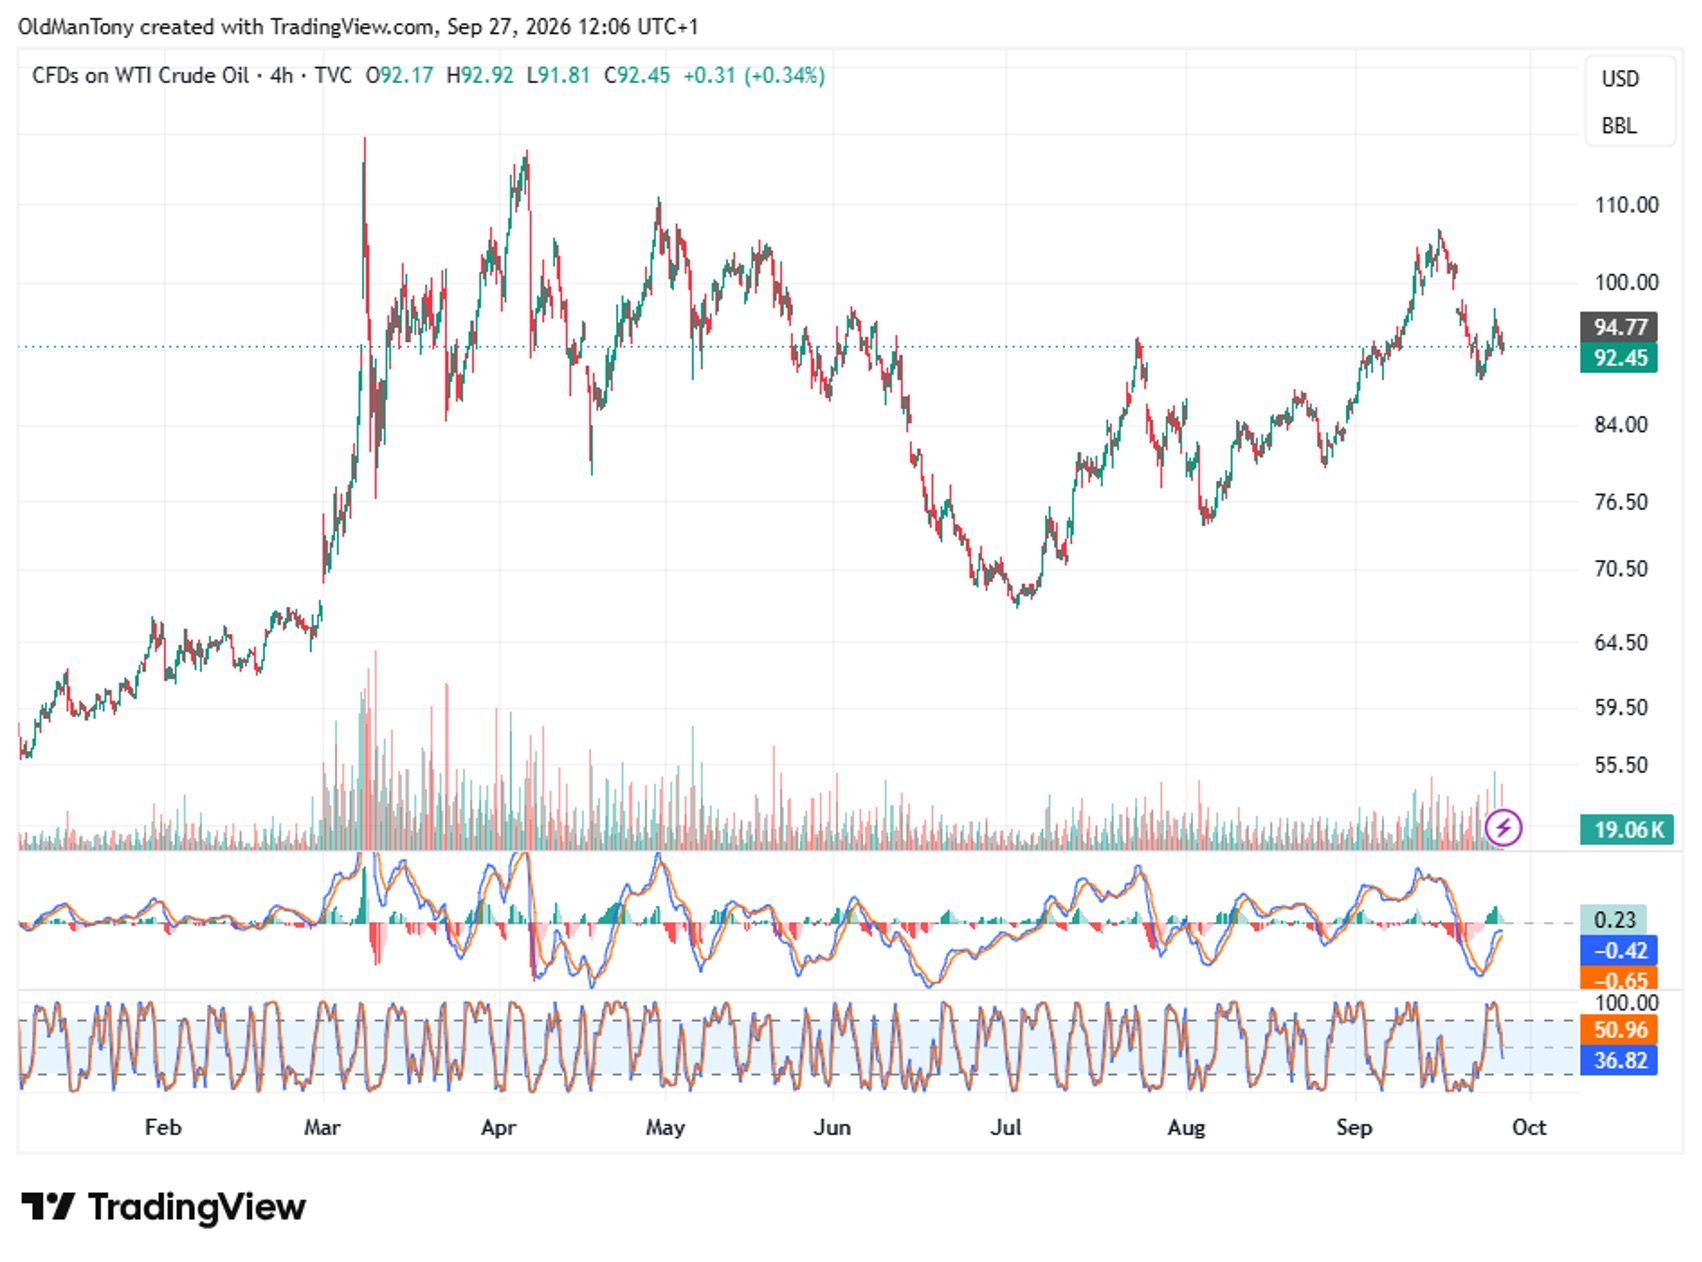
WTI has continued correcting after September's run above $100, but we're now seeing tentative signs that the selling pressure may be exhausting itself. Price around $92.45 is testing a region that acted as significant resistance earlier in the year and could now become support.
The first important band is $90–92. Below there, we'd look towards $87–88, followed by the stronger structural support around $83–85. Resistance sits around $94.50–95, then $98 and the psychologically important $100 level. The September high around $103–105 remains the major upside hurdle.
The price structure from the September peak continues to show lower highs and lower lows, so technically the immediate trend is still corrective. However, the decline has become noticeably less aggressive around $90–92.
MACD reflects that change. Although both lines remain below zero, the histogram has turned positive and the MACD line is beginning to rise towards its signal line. That's often the first stage of a momentum reversal. We'd want the crossover completed and price above $95 before putting much faith in it.
Stochastic RSI around 37/51 has recovered from deeply oversold readings and is now neutral. Importantly, oil can rise considerably before the oscillator becomes overbought again.
Our Elliott count still favours a completed five-wave advance from July's $68 low into September's $104 region, followed by the current A-B-C correction. We may already be somewhere within, or perhaps completing, Wave C.
The key for us is $90. Hold that area and a recovery towards $95–100 looks entirely reasonable. Break it decisively and the corrective target shifts towards $85.
The big bull move isn't necessarily dead; it's just having a lie-down.
Gold (XAU/USD)
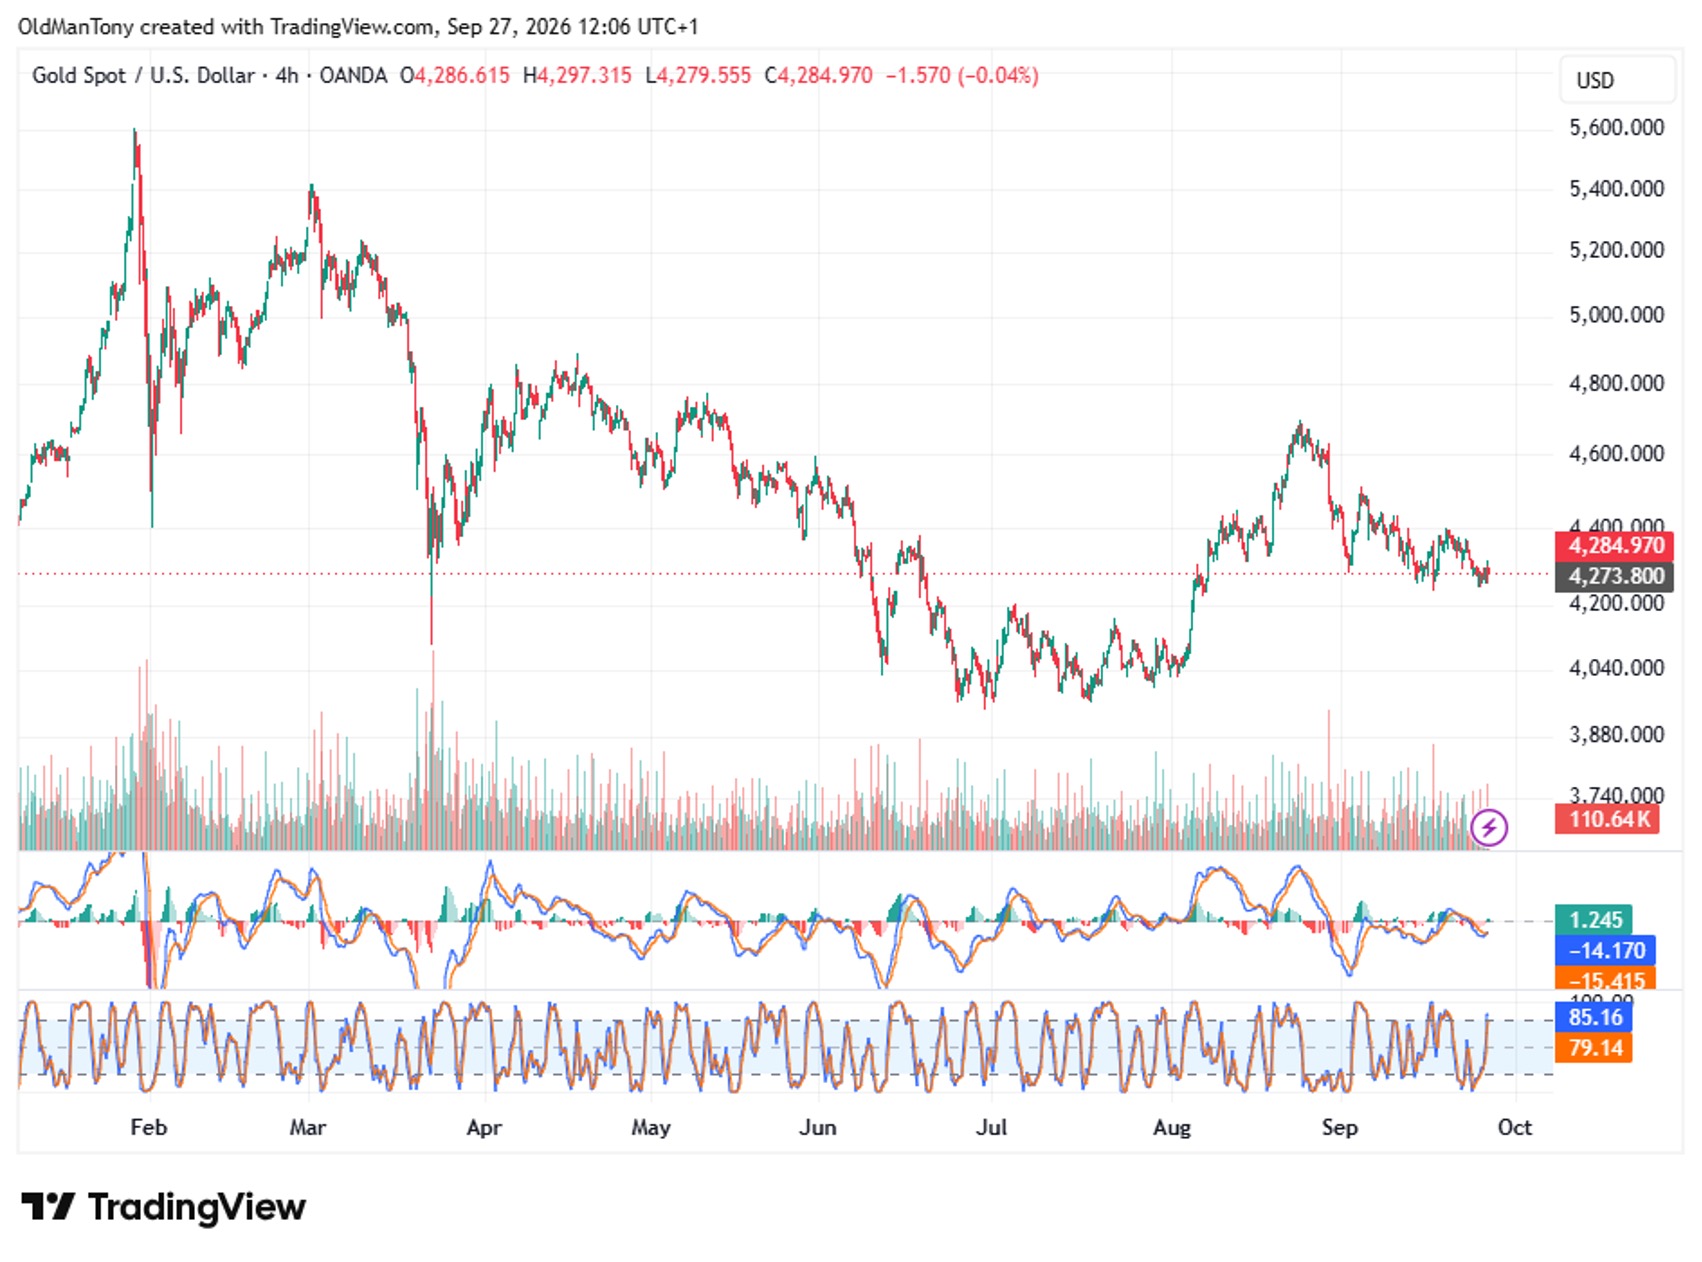
Gold has weakened since our previous review and is now testing an increasingly important support region. Price around $4,285 has retreated from September's $4,650–4,700 high and continues to establish lower highs, meaning the short-term recovery trend has clearly lost momentum.
The immediate support zone is $4,250–4,275. That's crucial. Below it we'd look towards $4,180–4,200, followed by the broader $4,050–4,100 base. Resistance initially sits around $4,340–4,380, with $4,450 and $4,600 becoming progressively more important.
The chart since early September has the appearance of a downward channel or descending corrective structure. Until gold starts breaking those lower highs, we'd remain cautious about calling the bottom.
MACD is below zero, with the MACD line around -14, confirming that the underlying short-term momentum remains bearish. The histogram has turned slightly positive, however, suggesting the rate of decline is slowing. That's an early improvement rather than a confirmed reversal.
The interesting contradiction comes from Stochastic RSI, sitting around 85/79. Gold has bounced enough to push the oscillator towards overbought territory despite price remaining near recent lows. That isn't particularly encouraging. It means the current bounce could easily run out of steam before the larger trend changes.
Our Elliott interpretation remains that the June-August rise may have completed a five-wave recovery near $4,650. If that's correct, we're currently inside an A-B-C correction, with the September decline potentially forming Wave C. Whether C has completed remains uncertain.
We'd need a recovery above $4,400–4,450 before becoming materially more bullish. Conversely, a decisive break below $4,250 would suggest another leg down towards $4,100.
Gold isn't broken, but right now we'd say the bears still have the shorter-term steering wheel.
UK100 Index
Tesla
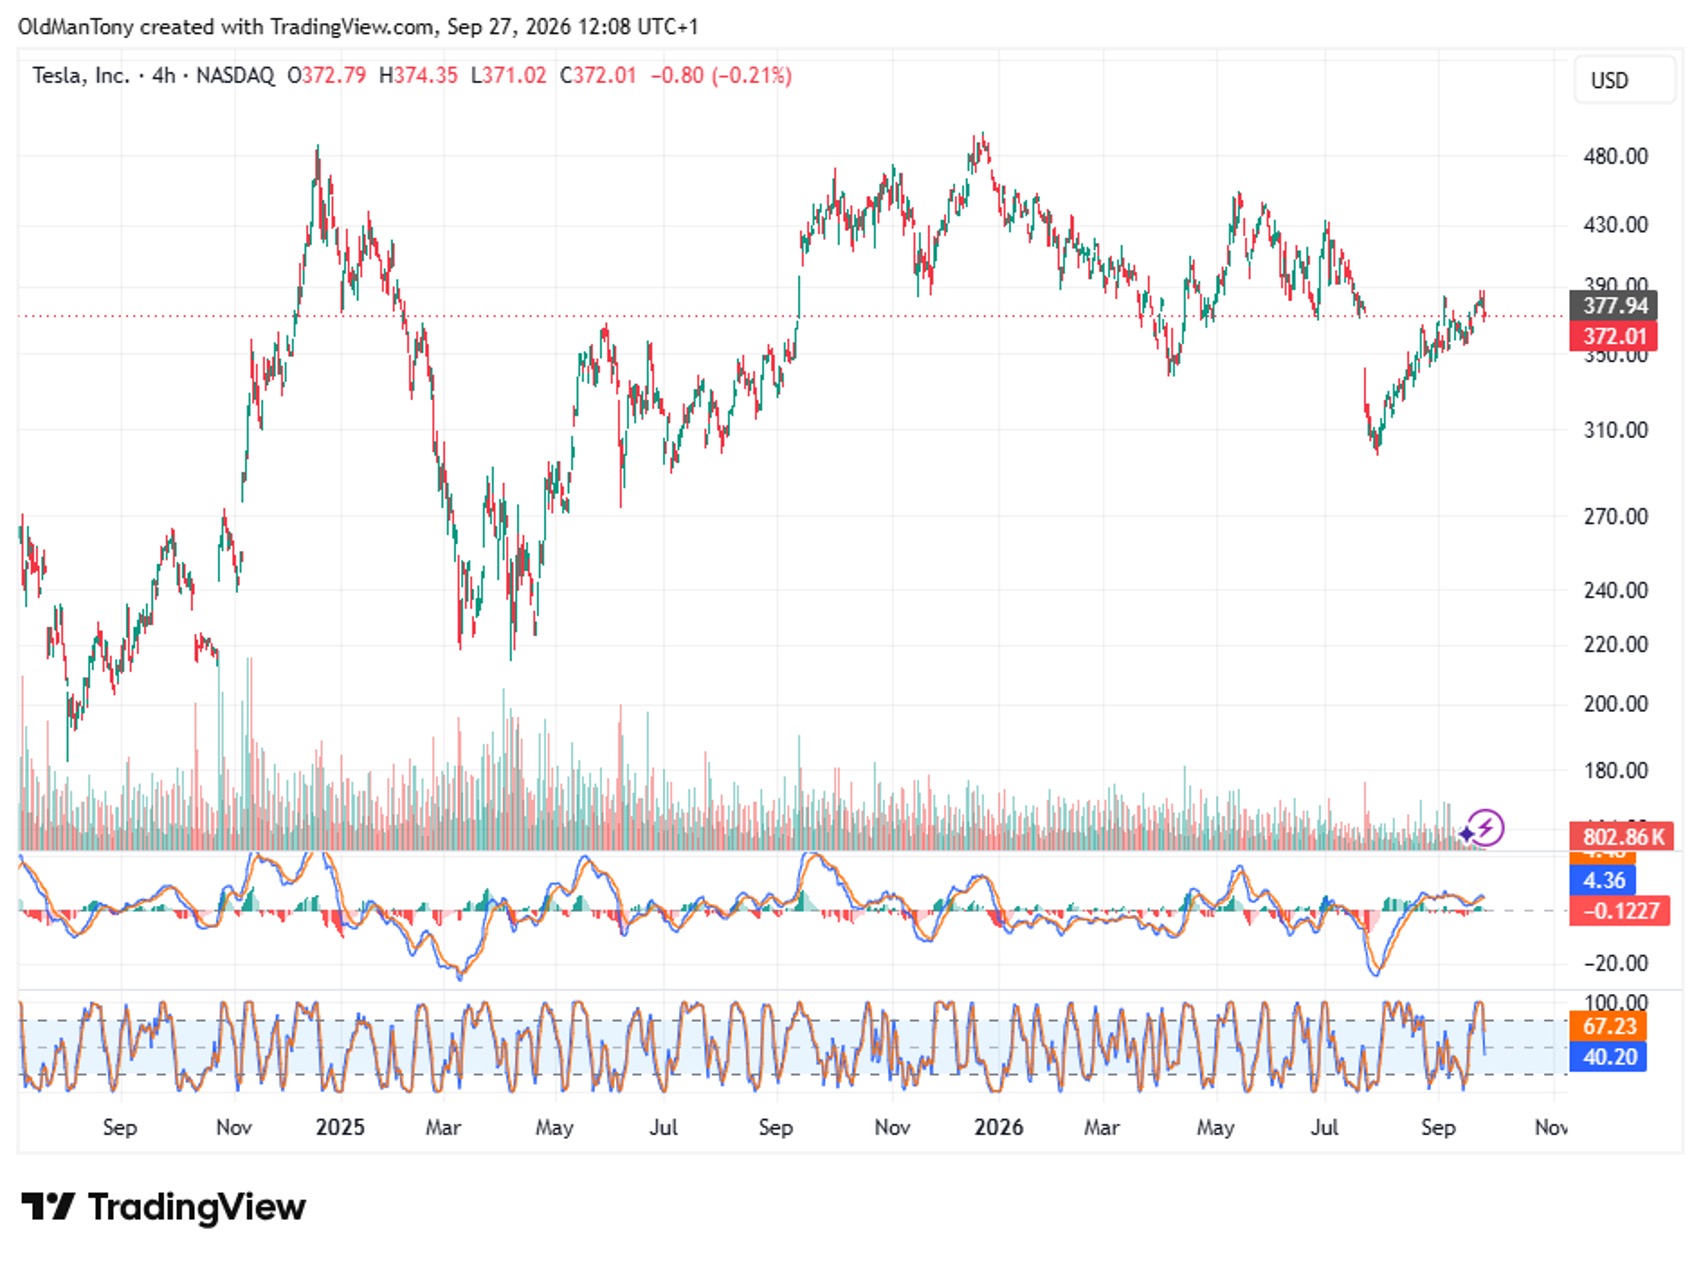
Tesla's recovery continues to grind higher, but we're now approaching an area where the chart needs to prove itself. Price around $372 has risen significantly from July's $300 region, yet it remains beneath a sizeable band of historical resistance between roughly $380 and $400.
We see immediate resistance at $378–385, with $390–400 representing the more important breakout zone. Above $400, Tesla could quickly attract attention towards $420–430. Support sits around $360–365, then $345–350. Losing $345 would undermine the current recovery and reopen the possibility of $325 and eventually $300.
The current structure is encouraging because the July low was followed by a relatively orderly sequence of higher lows and higher highs. However, the rally has slowed significantly as it approaches previous congestion. Tesla needs to punch through rather than spend another month admiring $380 from underneath.
MACD remains marginally positive, with the MACD line around 4.36, but the histogram has slipped slightly negative. That tells us upward momentum is flattening rather than collapsing. We'd like to see another bullish crossover accompanied by price clearing $380 before becoming more enthusiastic.
Stochastic RSI is mixed, around 40/67. It has backed away from overbought conditions and isn't currently stretched. That leaves room for another upside push.
Our Elliott interpretation is that the move from July's $300 low could represent an impulsive five-wave recovery. We may currently be developing a later Wave 4 consolidation before another Wave 5 push, although the internal structure isn't especially clean.
For us, $380–400 is the decision zone. Break it and the medium-term picture improves considerably. Rejection followed by a break below $350 would tell us the rally has probably run out of electricity.
NVIDIA
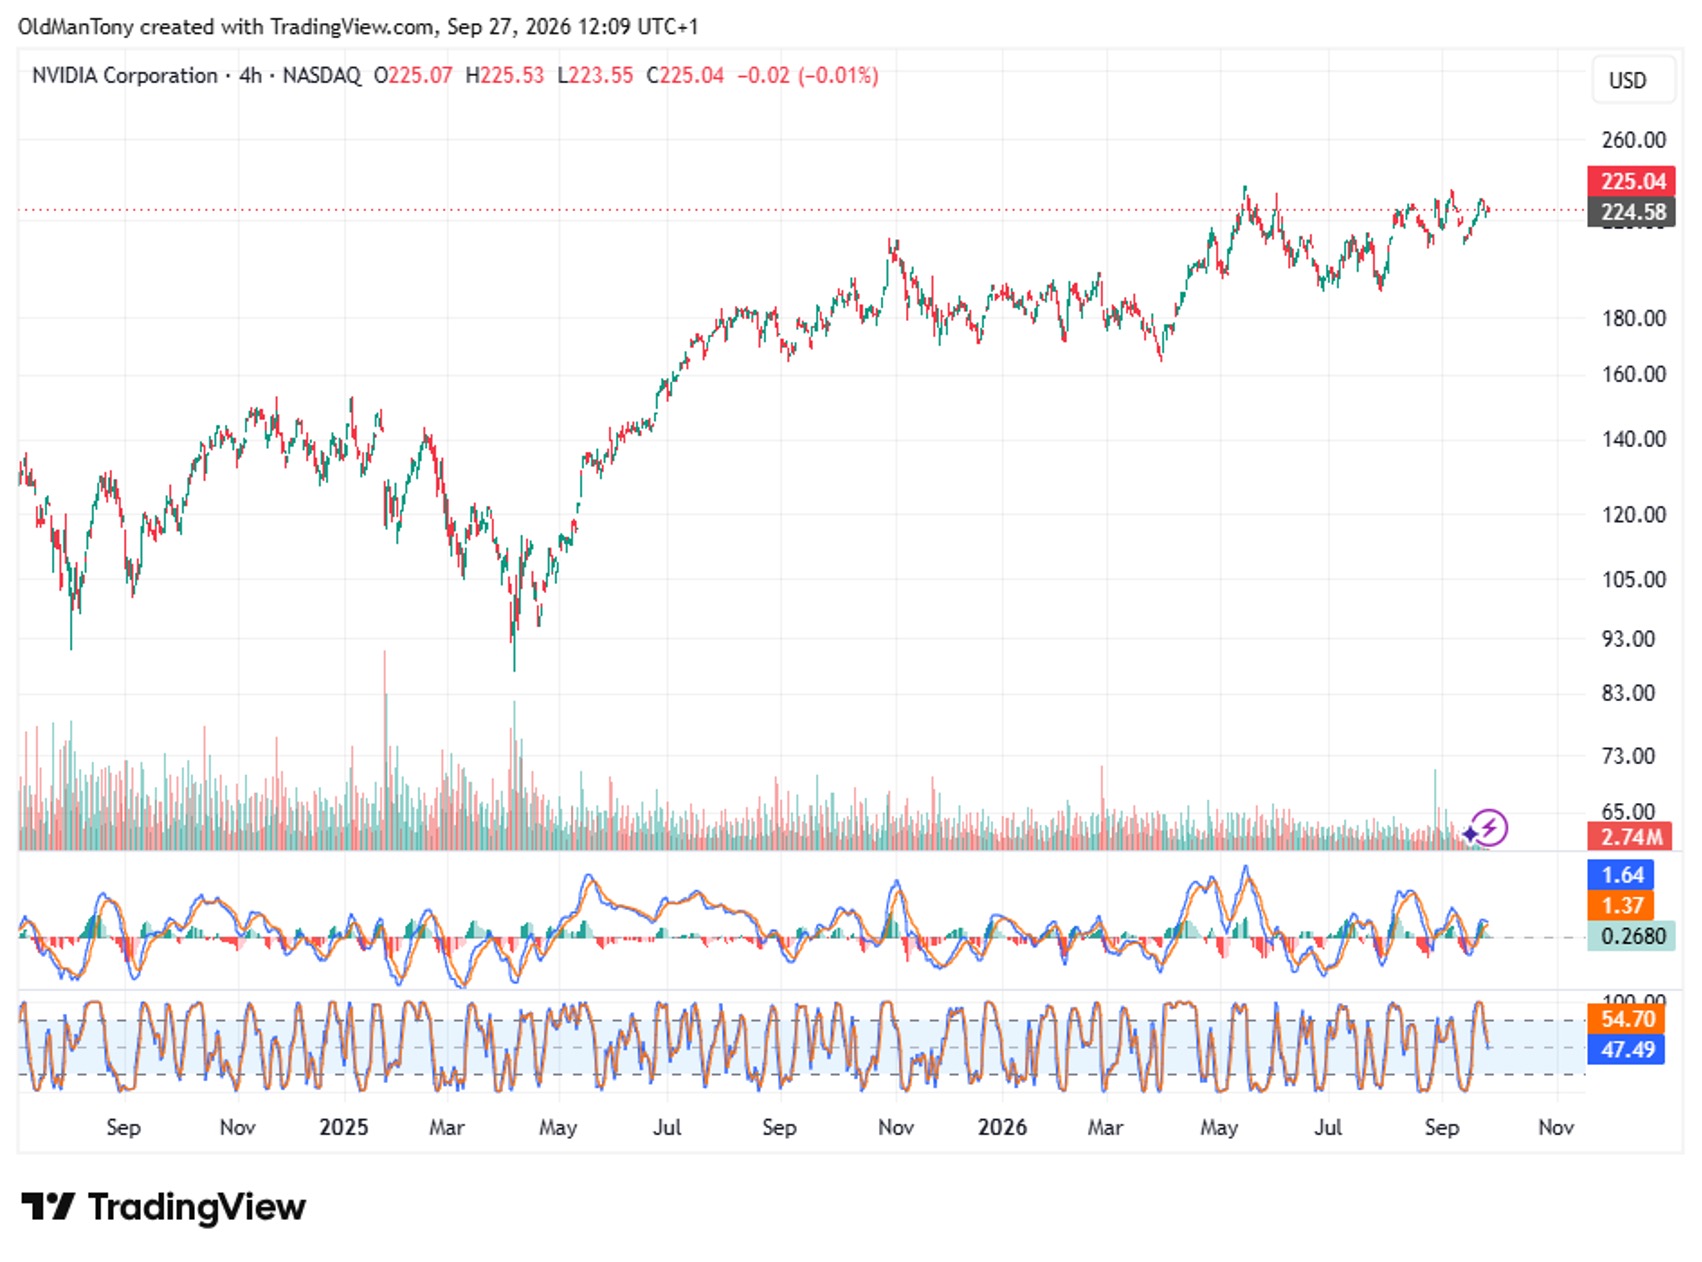
NVIDIA remains one of the technically stronger charts in the group, although the character has changed from aggressive trend to consolidation near the highs. At roughly $225, price is sitting just beneath the important $228–235 resistance zone, where the May peak and several subsequent rallies have struggled. The bullish point is that sellers haven't managed to push NVDA very far away from that ceiling. Instead, we're seeing repeated higher lows and tight consolidation, which often precedes another breakout attempt.
Immediate support sits around $218–220, followed by $210–212. Below there, we'd start looking towards $200. On the upside, a clean close above $232–235 would be technically significant and could open $245 initially, with $250–260 becoming realistic extension territory.
MACD is mildly constructive. The MACD line is above the signal line at approximately 1.64 versus 1.37, while the histogram remains positive. Momentum isn't screaming higher, but importantly it isn't confirming any serious deterioration either. We'd describe this as bullish consolidation rather than exhaustion.
Stochastic RSI around 47/55 is beautifully neutral. Unlike last week's heavily overbought reading, the oscillator has reset without NVDA suffering much price damage. That's generally constructive because there's now plenty of room for momentum to expand if resistance breaks.
From an Elliott perspective, the advance from April still looks compatible with a five-wave structure. We're potentially watching a sideways Wave 4 within a larger final advance, or alternatively a developing extension within Wave 5. Elliott counting becomes messy around these sideways highs, so we wouldn't marry either interpretation.
Our important level is $218. Above there, we'd continue giving the bulls the benefit of the doubt. Above $235, we'd regard the breakout as confirmed.
Glossary
Stochastic RSI (StochRSI):
The Stochastic RSI is a momentum indicator that combines the Stochastic Oscillator and the Relative Strength Index (RSI) to measure the speed and direction of price movements. It is primarily used to identify overbought or oversold conditions, helping traders anticipate potential trend reversals. By focusing on the relative position of the RSI within its recent range, StochRSI offers more sensitivity to price changes, making it ideal for spotting short-term trading opportunities.
MACD (Moving Average Convergence Divergence):
The MACD is a trend-following and momentum indicator that highlights changes in an asset's strength, direction, and duration. By comparing short-term and long-term moving averages, the MACD helps traders identify potential buy or sell signals and confirm the overall trend. Its histogram visually represents momentum, making it useful for gauging the strength of market moves and spotting potential reversals or continuations.
Elliot Wave:
Elliott Wave Theory, developed by Ralph Nelson Elliott in the 1930s, is a technical analysis tool that predicts market price movements through repetitive patterns called waves, driven by investor psychology. It suggests prices move in a cycle of eight waves: a 5-wave impulsive structure in the direction of the main trend (Wave 1 starts the trend, Wave 2 pulls back, Wave 3 is the strongest, Wave 4 pulls back again, and Wave 5 completes the trend), followed by a 3-wave corrective structure (Wave A moves against the trend, Wave B bounces, and Wave C moves against the trend again). These patterns repeat across different time scales, reflecting market sentiment swings between optimism and pessimism. By identifying these waves, traders can anticipate price movements and make better decisions on when to buy or sell.
Disclaimer: This article is for educational purposes only and should not be considered financial advice. Market conditions can change rapidly, and trading involves significant risk.
Follow us, and keep yourself up to date with news and views about what's going on in the world's financial markets.
Latest News

The Anatomy of the Perp Basis: How Funding Rates Drive Crypto Liquidity and Cascades

Widening Gaps

Bonds Are Screaming, Stocks Are Smiling – Something Has to Give